|
<< Click to Display Table of Contents >> Distributions - Histograms |
  
|
|
<< Click to Display Table of Contents >> Distributions - Histograms |
|
Main definition
Many graphical results are presented as histograms (bar charts).
An histogram is a graph describing the distribution of a resulting accumulated variable (for example energy) as a function of a state variable (for example power).
The accumulated variable is stored in "bins" (also named bars or classes), according to some operating condition defined as the abscissa.
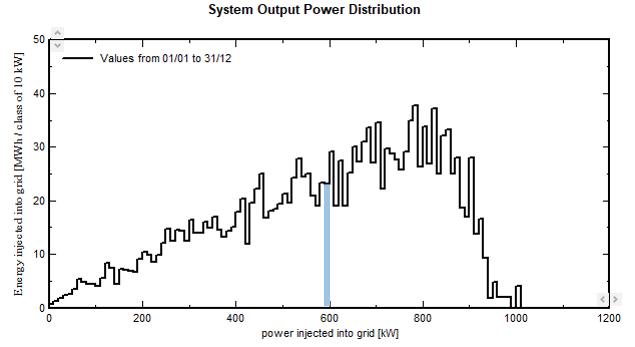
Energy distribution Histograms
Let's take the example of energies accumulated as a function of power.
The considered PV plant is a simple system in sheds, of PNomPV = 1.126 MWp and inverters PNomac = 1 MW.
A bin or class is the accumulation of the energy for each simulation time step when the power lies between the 2 values Pn and Pn+1.
This example shows in blue the "bin" between 590 and 600 kW. Its height represents the total energy produced during the year, when the system was running between 590 and 600 kW.
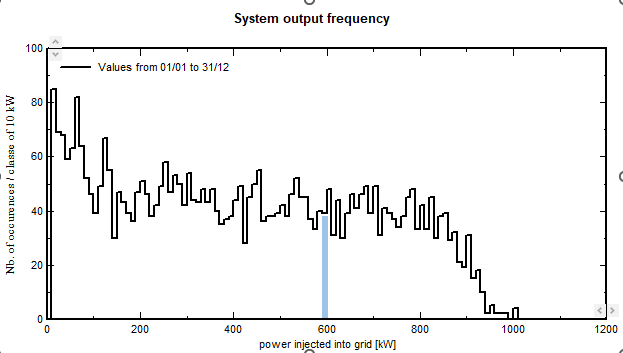
Operating time distribution Histograms
We can do the same exercise by accumulating the operating time (number of hours), again as a function of the power.
Here the blue bar height represents the number of hours in the year, during which the system power operated between 590 and 600 kW.
This gives a different figure, as in the previous graph the energy is increasing with the power.
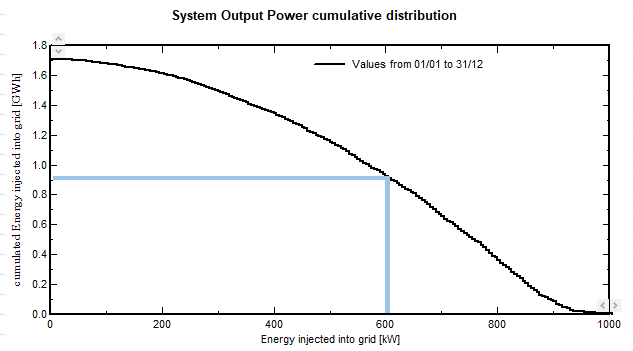
Cumulative distribution
In the cumulative distribution, each class contains the total energy of all running situations when the power was superior to the considered class power.
Therefore the first class contains the whole production of the year (here about 1.7 GWh).
We can observe that 0.92 GWh are produced when the system operates higher than 600 kW, i.e. 54% of the production.