|
<< Click to Display Table of Contents >> Typical power distributions |
  
|
|
<< Click to Display Table of Contents >> Typical power distributions |
|
See "Histograms" for the definition of a distribution.
The annual production distribution as a function of the Power may be quite different according to the system kinds.
Installation at Marseille
Let's take as example a simple PV plant installed at Marseille (Europe, 43.5° latitude) with:
| - | Installed power PNomPV = 1.126 MWp |
| - | Inverters PNom = 1 MWac |
We have analysed 3 different system kinds:
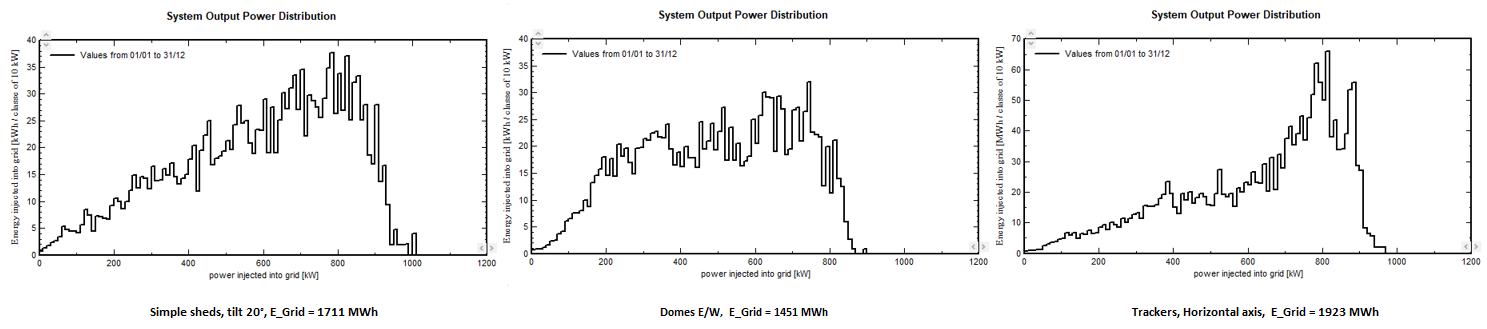
We can observe that the nominal PV power at STC (1.126 MWp) is never attained in any configuration.
•This is partly due to the fact that the maximum irradiance on a tilted plane is of the order of 1000 W/m2 - rarely more. And the STC performance is specified for an array temperature of 25°C, when the usual array temperature at full sun is of the order of 55-60°C. With a temperature coefficient of -0.34 %/°C, this represents a power loss of 10 to 12%.
•But this is also due to the fact that the sun's rays are rarely or never perpendicular to the PV plane. In this respect, the best situation is the fixed planes (sheds) at 20° tilt. The domes are never well oriented, so that the production is limited to around 850 kW. The trackers with horizontal axis are horizontal in the middle of the day, therefore not perpendicular to the sun (except in subtropical regions); we see that the significant high power situations are slightly lower than for the sheds (limit at around 900 kW).
The global distribution is also rather different:
•The sheds layout shows a global production rather proportional to the instantaneous power, up to about 800 kW. This is a consequence of the frequency distribution, rather constant for this climate (see the previous page Histograms).
•The domes production is enhanced at lower powers, as systems in both orientations are not working at the same time. The average operating power is lower, but better distributed in the day 8morning and evening).
•As expected, the trackers have a very high production distribution at higher powers.
Installation at Dakar
If we do the same exercise, with the same systems, at Dakar (Latitude = 14.8°, subtropical):
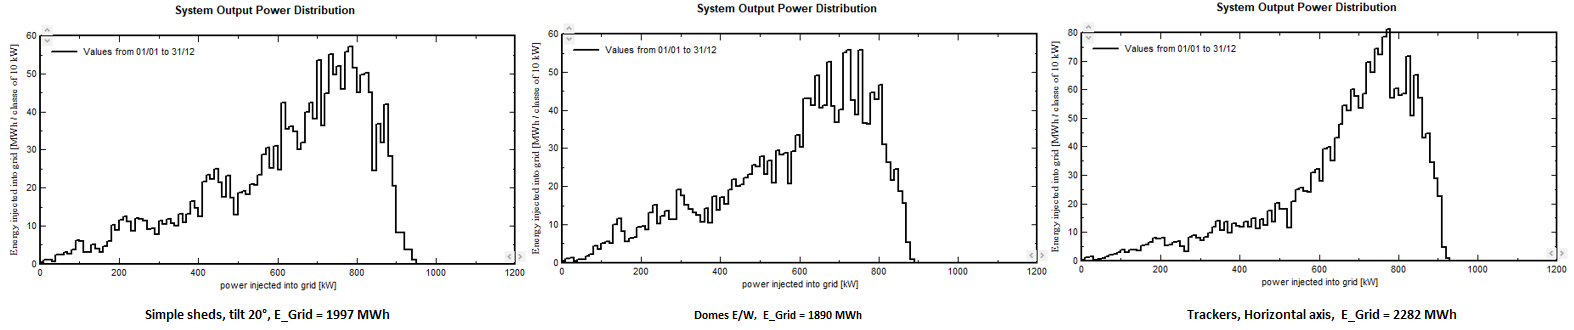
The distributions are is not so different.
•The maximum power falling edges are comparable or slightly lower, probably due to the temperature.
•The domes are pushed towards higher powers, the distribution is as high as for the sheds (very similar). Moreover, their performance with respect to a fixed plane at 20° south is significantly better: the yield ratio Domes/Sheds was 84.9% at Marseille, and becomes 94.6% at Dakar. However this may be partially due to the fact that a shed at 20° is not the optimal at Dakar (a more horizontal plane would be better suited).
•The gain of the tracking with respect to fixed plane is 12.4% at Marseille, and 14.2% at Dakar. Again, this difference may be due to the fact that the shed's tilt is not optimal.
PNom ratio - DC:AC
These distributions with different system kinds in different climates confirm the observation done since a long time in PVsyst. The desigh rule of a PNom ratio = 1.25 to 1.3 for avoiding overload losses may be considered as a general rule, quasi independent of the system kind and the climate.
Here the PNom = 1.126 kWp, when almost all distributions don't significantly exceed 900 kW, which means a DC:AC ratio of 1.25.