Typical power distributions
See "Histograms" for the definition of a distribution.
The annual production distribution as a function of the Power may be quite different according to the system kinds.
Installation at Marseille
Consider a simple PV plant installed at Marseille (Europe, 43.5° latitude) with:
- Installed power PNomPV = 1.126 MWp
- Inverters PNom = 1 MWac
Three different system types are analyzed:
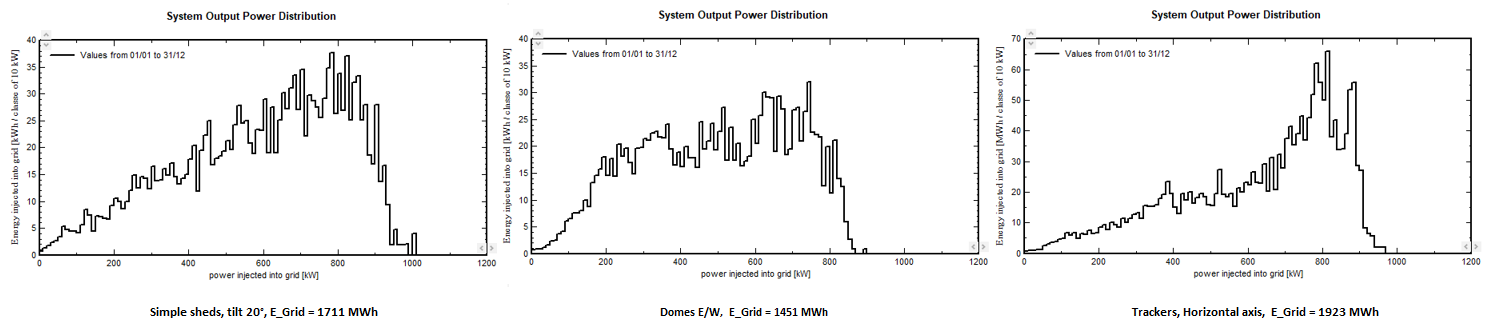
The nominal PV power at STC (1.126 MWp) is never achieved in any configuration.
- This is partly because the maximum irradiance on a tilted plane is typically around 1000 W/m²—rarely more. Additionally, STC performance is specified for an array temperature of 25°C, whereas the typical array temperature at full sun is around 55–60°C. With a temperature coefficient of −0.34%/°C, this represents a power loss of 10–12%.
- Additionally, the sun's rays are rarely or never perpendicular to the PV plane. In this regard, fixed planes (sheds) at 20° tilt offer the best situation. Domes are never optimally oriented, so production is limited to around 850 kW. Horizontal-axis trackers are horizontal at midday, therefore not perpendicular to the sun (except in subtropical regions); significant high-power situations are slightly lower than for sheds (limited to around 900 kW).
The overall distribution differs as well:
- Sheds layout shows global production roughly proportional to instantaneous power, up to about 800 kW. This results from the frequency distribution being fairly constant for this climate (see the previous page Histograms).
- Dome production is enhanced at lower powers because systems in both orientations do not operate simultaneously. Average operating power is lower but better distributed throughout morning and evening.
- As expected, the trackers have a very high production distribution at higher powers.
Installation at Dakar
Using the same systems at Dakar (Latitude = 14.8°, subtropical):
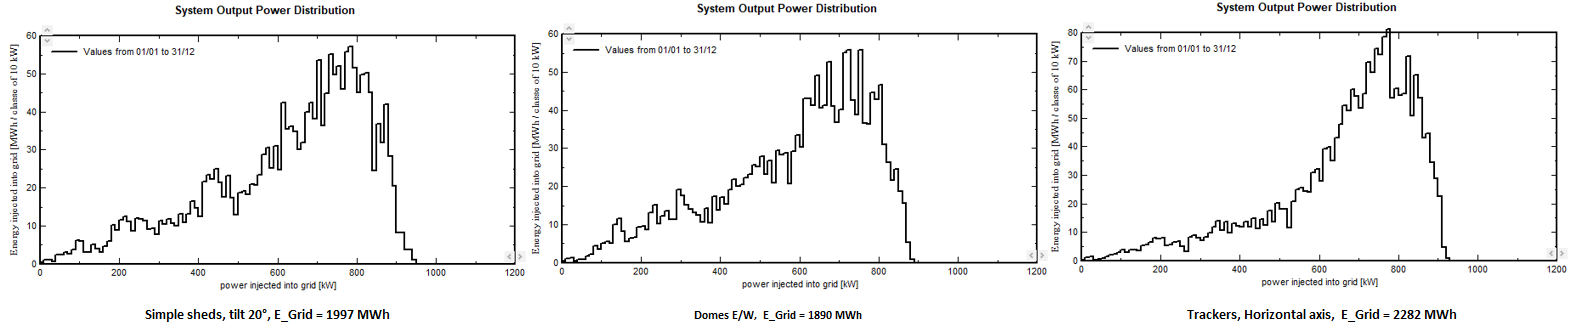
The distributions are fairly similar.
- Maximum power edge values are comparable or slightly lower, likely due to temperature effects.
- Domes are shifted toward higher powers, with distribution comparable to sheds. Additionally, their performance relative to a fixed plane at 20° south is significantly better: the yield ratio Domes/Sheds was 84.9% at Marseille and increases to 94.6% at Dakar. However, this may be partly because a 20° shed is not optimal at Dakar (a more horizontal plane would be more suitable).
- Tracking gain over fixed planes is 12.4% at Marseille and 14.2% at Dakar. Again, this difference may be attributed to the shed tilt not being optimal.
PNom ratio - DC:AC
These distributions across different system types and climates confirm long-standing observations in PVsyst. The design rule of a PNom ratio = 1.25 to 1.3 for avoiding overload losses can be considered a general principle, nearly independent of system type and climate.
Here, PNom = 1.126 kWp, while most distributions do not significantly exceed 900 kW, corresponding to a DC:AC ratio of 1.25.