P50 - P90 evaluations
The P50–P90 evaluation is a probabilistic approach for interpreting simulation results over several years.
This requires several additional parameters that are not provided by the simulation and must be specified (assumed) by the user.
Procedure summary
To activate the P50–P90 tool, click the Energy Management button and go to the "P50–P90 estimation" page in the grid project dialog.
Do this after an initial simulation, as the P50 value corresponds to the simulation output by default.
First select the "Kind of Data", which affects how the P50 value is determined.
Then specify the shift, weather data annual variability, and other simulation uncertainties.
Finally, you may specify whether you want P90 or other values. The result will appear on the report if the parameters are correctly specified (no warning).
NB: This feature is not available for Stand-alone and Pumping systems, where it is more difficult to define.
Probability law
This approach assumes that over several years of operation, the distribution of annual yields will follow a Gaussian (or normal) distribution.
P50 and P90 represent different yield levels. There is a 50% probability that annual production will exceed the P50 value and a 90% probability it will exceed the P90 value.
The task is to establish the two parameters of this Gaussian distribution: the mean value and the standard deviation (also called sigma or RMS).
The main contributors to these parameters are the uncertainty and variability of weather data. However, other uncertainties in the simulation process and parameters should also be considered.
Uncertainties on Weather data
Commonly available weather data typically have uncertainties of various types, which can produce significant differences between sources or between years from the same source. These include:
- The yearly variability, which is supposed to have a Gaussian distribution,
- The quality of the data recording, care of the operators, positioning, calibration and drift of the sensors, perturbations like shadings, dirt or snow on the sensors, etc.
- The presence of a not negligible horizon for terrestrial measurements,
- The location difference (distance of measuring station) for terrestrial measurements,
- The quality of the models used for interpreting the satellite data, which is in continuous improvement since 20 years,
- Climate evolution: In Europe, irradiation appears to have increased by as much as 5% since the beginning of the 21st century.
See the differences in the PVGIS data between the old database and the more recent "Climate-SAF" database.
Another example: in Geneva, for official measurements of the ISM, the 2003-2011 average is 10% above the 1980-2002 average, which is probably an extreme situation.
However, if your data averages are mostly from after 2000, you can set this value to null.
Details
P50 determination - Kind of data
The simulation result is closely related to the weather data used for the simulation. This data may be of different types, which must be specified in the "Kind of data" parameter:
- If the data represent an average over several years ("Monthly averages" or "TMY, multi-year"), the simulation result should be considered as an average and generally corresponds to P50 (the mean value of the Gaussian). However, PVsyst allows you to account for a specified climate change: this shifts the mean P50 value relative to the simulation result. This is useful for interpreting simulations performed with older average data (Meteonorm, PVGIS classic, etc.), which are known to be lower than current climate conditions.
- If the data are for a specified year ("Own measured" or "Specific year"), they cannot be considered representative of the P50 value. Without additional information, you cannot determine a reliable P50–P90 indicator. However, if you have information about the site's typical average, you can enter an estimate of how this particular year deviates from that average. This will also shift the P50 value relative to the simulation result.
Note that the software will determine automatically the kind of data for most known sources.
Variability determination
The annual variability (sigma value) is dominated by weather data year-to-year variability. This information is not commonly available.
- A report by Pierre Ineichen (2011)1 provides evaluations for about 30 sites worldwide. PVsyst offers default values based on this data.
- Meteonorm versions 7.2, 7.3, 8.X, and 9.0 provide this information for your site (see the "site definition" dialog, "Monthly Meteo" page).
- Several weather data providers now deliver multi-year weather data (15–25 years of data) that you can import directly into PVsyst (for example, SolarGIS, 3-Tiers Vortex, Soda-Helioclim, or others). If you have such weather data for your site, you can calculate the RMS of the annual GlobInc distribution. PVsyst has a tool for this: use "Databases > Compare Weather Data" and select the corresponding MET files for different years. The "Histo and Probabilities" option shows the Gaussian distribution, average, and RMS.
Additional uncertainties in the simulation process can be considered. These deviations should represent random year-to-year variability of the uncertainty, not the absolute uncertainty.
- PV module model and parameters (the main uncertainty after weather data)
- Inverter efficiency (negligible)
- Soiling and module quality loss (highly dependent on site conditions)
- Long-term degradation (not compatible with the P90 evaluation concept)
- Custom other contributions
These random contributions add quadratically, providing a global standard deviation that is used to construct the final Gaussian distribution function and estimate P90 or other P_xx_ values.
This is for specialized uses. In typical situations, you can set all these values to null.
NB: In the Gaussian distribution function, P90 represents a shift of -1.28 sigma, P95 => -1.64 sigmas, and P99 => -2.35 sigmas.
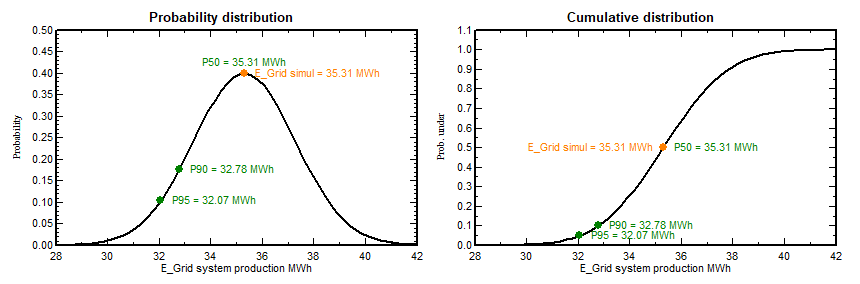
PVsyst displays a graphical representation of your choices, either as a Gaussian probability distribution for several years or as the corresponding cumulative distribution (the integral of the Gaussian).
In this example, the simulation used a specific year assumed to be 3% below the yearly average. Therefore, the P50 value is higher. A positive climate trend would have the same effect.
Experimenting with the uncertainty parameters is instructive for understanding how representative the simulation result is for future years. Note that, given your interpretation of the simulation result (for example, E_Grid), the forecast production distribution can shift around your simulation result.
P90 Estimations for Monthly or Daily Values
P50–P90 statistical estimations are based on yearly values. Defining P90 for sub-hourly, hourly, daily, or even monthly accumulated values does not make sense.
When annual weather data variations are around 3–4% (RMS), the year-to-year variability of monthly data is much higher. Defining a probability profile for each month will produce erratic results.
Additionally, probability profiles for determining P90 are statistical estimations that should be based on significant weather series (at least 15–20 years of data).
However, we do not have such generic data for monthly values, and this would be highly dependent on climate and season.
To perform such evaluations, you should obtain 15 or more years of monthly weather data for your site and evaluate the probability distribution month by month.
Correction of Hourly/sub-hourly Values
Some people attempt to define P90 time series by simply reducing yearly hourly or sub-hourly results by the ratio of yearly yields (P90 / P50).
This is incorrect because your system will behave the same under clear conditions. A P90 "correction" would affect the distribution and frequency of poor weather conditions, not the absolute yield of each time step.
Some weather data providers offer weather data time series corresponding to P90 or other P_xx_ values. We do not know how these data are calculated or their significance.
-
P. Ineichen
Global irradiation: average and typical year, and year-to-year variability
Research report of the Institut of the Environnemental Sciences, University of Geneva, 2011.
Available on https://www.pvsyst.com/en/company/publications/ ↩