Inverter / Array sizing
The inverter power sizing is a delicate and contested issue.
PVsyst provides a graphical tool (button Show sizing) for studying and understanding sub-array sizing, including array voltage (number of modules in series) and array power (number of strings).
In this tool, the upper graph concerns the Array voltage sizing. The histogram is a specific tool for the evaluation of the PNom Ratio, as explained below.
Preliminary observations about Pnom sizing
- The Pnom of the inverter is defined as the output AC power. The corresponding input power is PnomDC = PnomAC / Efficiency—approximately 3 to 5% higher. For example, a 10 kW inverter requires PNomDC = 10.5 kW input to deliver 10 kWac.
- The Pnom of the array is defined at STC. However, in real conditions, this value is rarely or never achieved. Power under 1000 W/m² and 25°C is equivalent to that produced under 1120 W/m² and 55°C with μPmpp = -0.4%/°C. Such irradiance is only reached episodically at most sites.
- Power distribution depends on the plane orientation: a façade will never receive more than 700-800 W/m², depending on latitude.
- Maximum instantaneous powers are not very latitude-dependent: on clear days perpendicular to the sun's rays, irradiance is fairly comparable, dependent only on air mass. However, it significantly depends on altitude.
- Many inverters accept some overload above their nominal power, specified by a Pmax parameter, depending on device temperature. This is not considered in the pre-evaluation and may reduce the overload loss calculated by the full simulation.
- When oversized, the inverter operates more often in its low power range, where efficiency decreases.
Sizing principle
In PVsyst, PNom ratio sizing is based on acceptable overload loss during operation and therefore involves estimations or simulations of energy yield under real conditions (weather data, orientation, losses) over the entire year. In this tool, the pre-evaluation is based on an energy distribution histogram, established using a rough pre-simulation. However, accurate determination of overload loss is only possible with detailed simulations. See below for details.
Taking the following into account:
A. Overload behavior: With all modern inverters, when the Pmpp of the array exceeds its PnomDC limit, the inverter maintains its safe nominal power by shifting the operating point on the PV array's I/V curve (toward higher voltages). Therefore, it does not draw any excess power; only the array's potential power is not generated. There is no power to dissipate, no overheating, and therefore no additional aging.
B. Loss evaluation: In this mode, the only energy loss is the difference between the Pmpp "potential" power and the PnomDC limit actually drawn. In power distribution diagrams, even when the inverter's power is slightly below the maximum powers achieved by the array in real operation, this results in very little power loss (violet steps relative to the green ones, barely visible). Simulation and analysis of overload loss is therefore an excellent means of assessing inverter sizing.
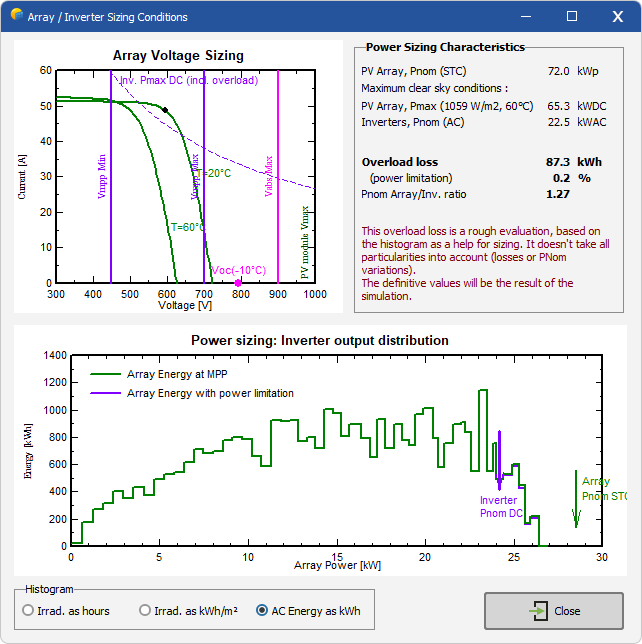
On the powers distribution histogram, the green curve is the potentially produced energy by the PV array (EArrPmpp), and the violet one is the power limited at the Pnom of the inverter. The overload loss is the area between both lines, with respect to the total area below the green curve.
The PVsyst criteria for an acceptable sizing are specified in the project's definition (menu "Project's settings"): by default:
| 3% > Overload Loss > 0.2% | inverter slightly undersized, warning (orange colour) |
| Overload loss > 3% | inverter strongly undersized, prevents the simulation. |
In practice, these criteria result in Pnom ratios of around 1.25 to 1.3 for most well-oriented systems (Pnom ratio > 2 for façades!). This ratio can become much higher when the inverter's nominal power can be increased to a value PMax at low temperatures.
To increase the PNom ratio above the default value, modify the overload limit in the project settings.
For economical optimization, final overload losses must be balanced against the price difference of a higher-power inverter. These considerations often lead to significantly undersized inverters compared to manufacturer recommendations.
Today, many large installations are subject to Injection Power Limitation required by the grid manager. This leads many PV designers to define highly oversized PV arrays, which means significantly higher energy yield at the cost of reasonable energy loss due to power limitation.
Difference with the hourly/sub-hourly simulation
Note that detailed simulation results (overload loss) may be significantly different from this sizing value (they typically show lower losses). This is because the histogram elaboration for this rough sizing tool does not account for all system losses. Additionally, the pre-simulation cannot account for the enhanced inverter nominal power at different temperatures.
The reference result is, of course, the detailed simulation result.