Parameters besides Datasheets
Beyond the basic electrical parameters Isc, Voc, Impp and Vmpp, the one-diode model implemented in PVsyst involves the following additional parameters, which are typically not provided in datasheets:
The shunt resistance RShunt
The shunt resistance is defined according to a default value hypothesis chosen by PVsyst: Rshunt = Vmpp / (0.2 * (Isc - Impp))
From our long-term outdoor measurements under sunlight for several technologies, we observed that the shunt resistance exponentially increases as irradiance decreases. This leads to 2 additional parameters:
- RshExp: the exponential parameter: across all our measurements, we observe this is a fairly constant value (= –5.5), regardless of technology. This value should not be modified.
- Rsh0: the intercept of the Rshunt curve at Irradiance = 0: this was found to be very stable for all thin film technologies (approximately 12 times the Rshunt at 1000 W/m²), and lower for crystalline modules (approximately 4 from our experiments, around 8 for typical indoor measurements of low-light performance made by independent laboratories).
Furthermore, with crystalline modules, the shunt resistance is fairly high, so its effect on Pmpp behavior is weak. Moreover, if the low-light performance is not quite accurate, this will be offset by the choice of Rseries value to ensure specified low-light performance.
The series resistance RSerie
Rseries appears to be the primary parameter governing the low-light behavior of PV modules (i.e., the evolution of low-light efficiency relative to STC efficiency). Therefore, we can use the relative efficiency under low-light conditions—now routinely measured by certification laboratories according to IEC 61853—to establish the Rseries value.
By default, for crystalline modules PVsyst sets Rseries to achieve a low-light relative efficiency of –3% @ 200 W/m².
NB: This is sometimes not achievable—the relative efficiency may not reach this value because RSmax limits the possible Rseries. In such cases, we must increase the Rshunt value, which increases the maximum possible RSmax value.
If this remains insufficient, we must increase the specified Voc at STC (typically a very small amount). We have observed that the Vmp/Voc ratio is typically much lower in measured value reports than in datasheets. We don't know how the manufacturers define their STC values for different power classes. We suspect that they reduce the Voc value in order to increase the Fill Factor.
Other Rseries values
For including modules in the PVsyst database: if manufacturers provide a detailed report of measured data according to IEC 61853 from an independent laboratory, we analyze these results and evaluate Rseries (and possibly Rshunt) to best match these measurements.
The muPmpp temperature coefficient
The temperature behavior of the maximum power point is normally a result of the one-diode model. However, this rarely corresponds exactly to the specified value mentioned on datasheets (often denoted "γ"), which is typically an explicitly measured value.
To match the specified value, PVsyst applies a small linear correction (as a function of temperature) to the gamma value. This parameter is named "muGamma" and is adjusted by PVsyst in order to match the specified muPmpp value.
See also Temperature behavior corrections for further details.
Fit on 5 parameters using IEC 61853 data
Many test laboratories typically provide these 5 PVsyst-specific parameters (Rseries, RShunt, RshExp, Rsh0, muGamma) from their measurements.
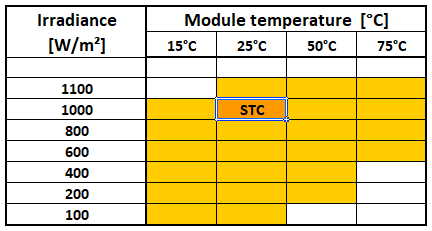
The IEC standard requires the measurement of the I/V curve (Isc, Imp, Vmp, Voc) at 23 different Irradiance and temperature conditions:
They perform a 5-parameters fit over these 23 values.
We consider that such a fit cannot accurately identify each of these parameters:
- First, because the uncertainties on these measured values are not negligible.
- Secondly, the number of experimental points is not sufficient for adjusting 5 parameters in such a non-linear set of equations.
- Thirdly, the measurements are averages on 3 modules of same power, i.e. not "pure" measurements.
- Fourth, the fit results are highly dependent on the chosen STC values. The parameters are needed not for this specific module (with its measured STC values), but for modules of different power classes with different STC values as specified on datasheets. The whole set of points has to be adjusted for each of these STC conditions, which are obviously not compatible with the STC measured values.
When analyzing the results of the same measurements for several power classes, the parameters typically differ completely for each power class.
In fact, expecting a reliable fit from such data is illusory: the 5-parameter function is likely highly variable, with minima and maxima between reference points. Moreover, it is not extensible or stable when reference data varies slightly.
NB: These fits usually produce aberrant values. For example, RshExp is often on the order of 10 to 15, indicating a very sharp exponential with constant values until very low irradiances—that is, no exponential behavior as a function of irradiance. This is in complete contradiction with all our measurements.
On some measurements, the muPmpp result from the fit was significantly different from the muPmpp value obtained by conventional direct measurement (i.e., numerous Pmpp measurements by continuously decreasing module temperature). During the simulation this parameter is essential for a good evaluation of the temperature losses.
PVsyst methodology for populating the database
We aim to find a robust result that can be extended to any "equivalent" module of different models or power classes.
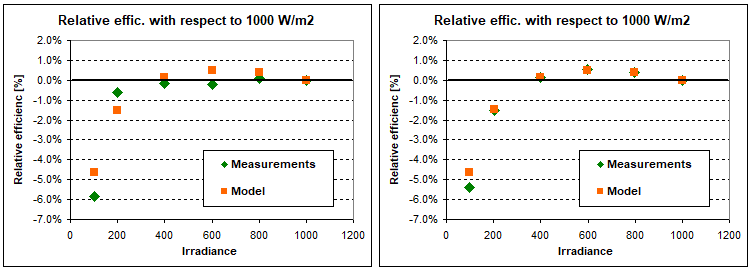
We treat the basic parameters (RshExp, Rsh0, muGamma) as constant according to their standard values (and our general measurements). We analyze only the low-light behavior at 25°C. For any module (of any power class), we choose Rseries (and possibly increase Rshunt) to reproduce this low-light performance.
NB: This analysis is not always straightforward: we observe that Isc often is not truly linear with irradiance. A 1% deviation in irradiance (obtained using filters) results in a 1% deviation in relative efficiency.
Therefore, we begin by analyzing the linearity of Isc with irradiance. Assuming this relationship is perfectly linear, we can correct the irradiance accordingly.
When doing this the rather erratic points on the measured relative efficiency curve become well aligned, and usually well matching the model.
Published measurements and corrected irradiance, showing linear relationship with measured Isc