Sub-hourly clipping correction
When running PVsyst simulations in hourly steps, inverter clipping would be evaluated on the basis of the hourly average IV curves of DC arrays. However, in reality, sub-hourly fluctuations in irradiance may push the maximum power point of a DC array temporarily below or above the inverter clipping threshold. This sub-hourly behavior leads to extra losses, which are not captured by simply using the hourly IV curve.
Since version 8.0, PVsyst offers a model to evaluate these supplementary sub-hourly clipping losses.
Implementation in PVsyst 8.1
PVsyst 8.1 introduced the option to run simulations directly at a sub-hourly time step from sub-hourly weather files. Since the simulation can now be run at the same time resolution as the source data, whether a clipping correction is needed — and how it is obtained — depends on the combination of simulation time step and MET file resolution. Therefore, several situations should be considered:
- No correction possible for:
- 1-minute simulations: this is already the maximum precision.
- Hourly simulations with 8.1 hourly MET files.
- Correction automatically applied when:
- Running an hourly simulation with a sub-hourly .MET file (any time step).
- Running a simulation with a v8.0 MET file containing a clipping correction.
- Resampled sub-hourly file: if your sub-hourly .MET file was resampled in PVsyst (at import or at simulation time), the clipping correction is applied. Example: a 15-minute simulation run from an original 1-minute .MET file will contain a clipping correction.
Deactivation
If you wish to deactivate clipping correction (not recommended), you may do so in the advanced parameters by setting use subhourly clipping correction to 0 (false). Note that this change will affect all projects.
Results
The sub-hourly clipping correction loss can be found among the simulation variables, and in the loss diagram.
It is represented among the simulation variables by "Sub-hourly inverter clipping correction". The variable tag is ILPmxSH. It is included in the Invert category for inverter losses.
In the loss diagram, the extra loss is grouped with IL_Pmax, the inverter loss over nominal power.

Model explanation
The model is based on two main observations:
- The hourly clipping loss is always lower than the sub-hourly clipping loss, and can always be evaluated as the area above or below the clipping threshold in the MPP time series plot.
- Most of the PV production processes do not depend on the ordering of time steps, i.e., the minutes in an hour can be reordered by increasing irradiance.
Based on these two points, it is possible to easily approximate the missing loss using few coefficients for each hour, extracted from the sub-hourly data.
The details of the model have been reported in a publication1.
Missing clipping loss evaluation
There are two cases where the hourly clipping loss evaluation is incorrect.
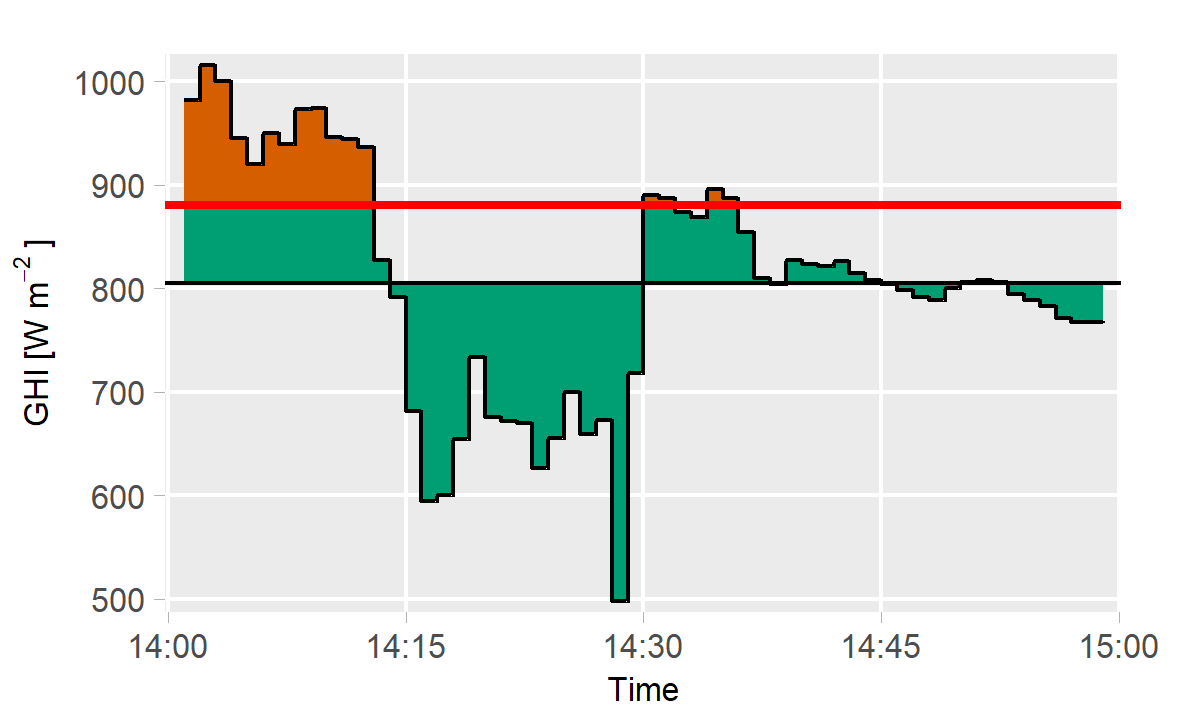
First, when the hourly average MPP is below the clipping threshold, but this threshold is passed at some times within the hour.
Second, when the hourly average MPP is above the clipping threshold, but this threshold is not reached at some times within the hour.
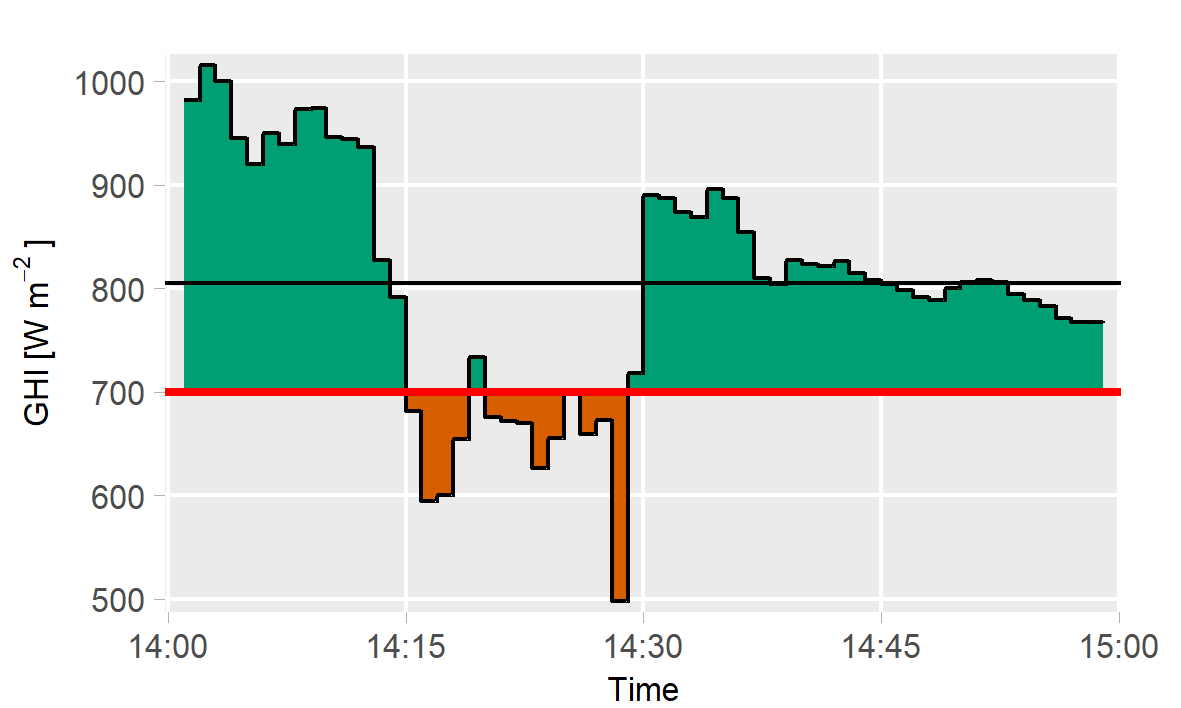
In the two figures above, the red line represents the equivalent clipping level in terms of irradiance, the black line represents the average hourly irradiance, and the orange area characterizes the missing clipping loss. In these two cases, the missing loss is characterized by the area above or below the threshold.
Reordering of minutes
Most of the physical processes in the simulation can be well represented by an instantaneous model. For example, the PV production primarily depends on the instantaneous irradiance. Therefore, the minutes within an hour can be rearranged without too much impact.
A counterexample is the temperature of the modules, which, due to thermal inertia effects, should depend on previous time steps. However, in terms of PV production, the effect of temperature is secondary to that of irradiance.
Approximation
Once the minutes have been reordered, it is possible to approximate the missing clipping loss by various means. We choose to represent the reordered irradiance evolution with two linear segments (in green in the figure below), above and below the average irradiance (horizontal black line).
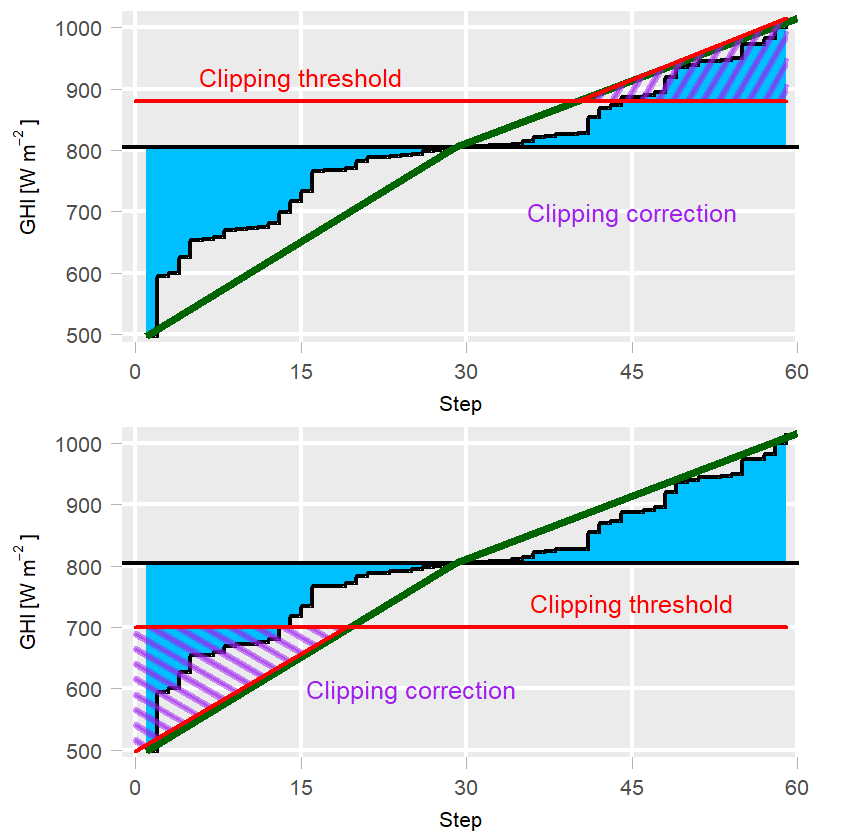
The clipping threshold (red line) can then be applied to the approximated, reordered sub-hourly irradiance evolution. This makes it possible to simply approximate the clipping correction.
The minimum information to be stored at each hour is, therefore, the maximum GHI, the minimum GHI, and the number of minutes above or below the threshold.
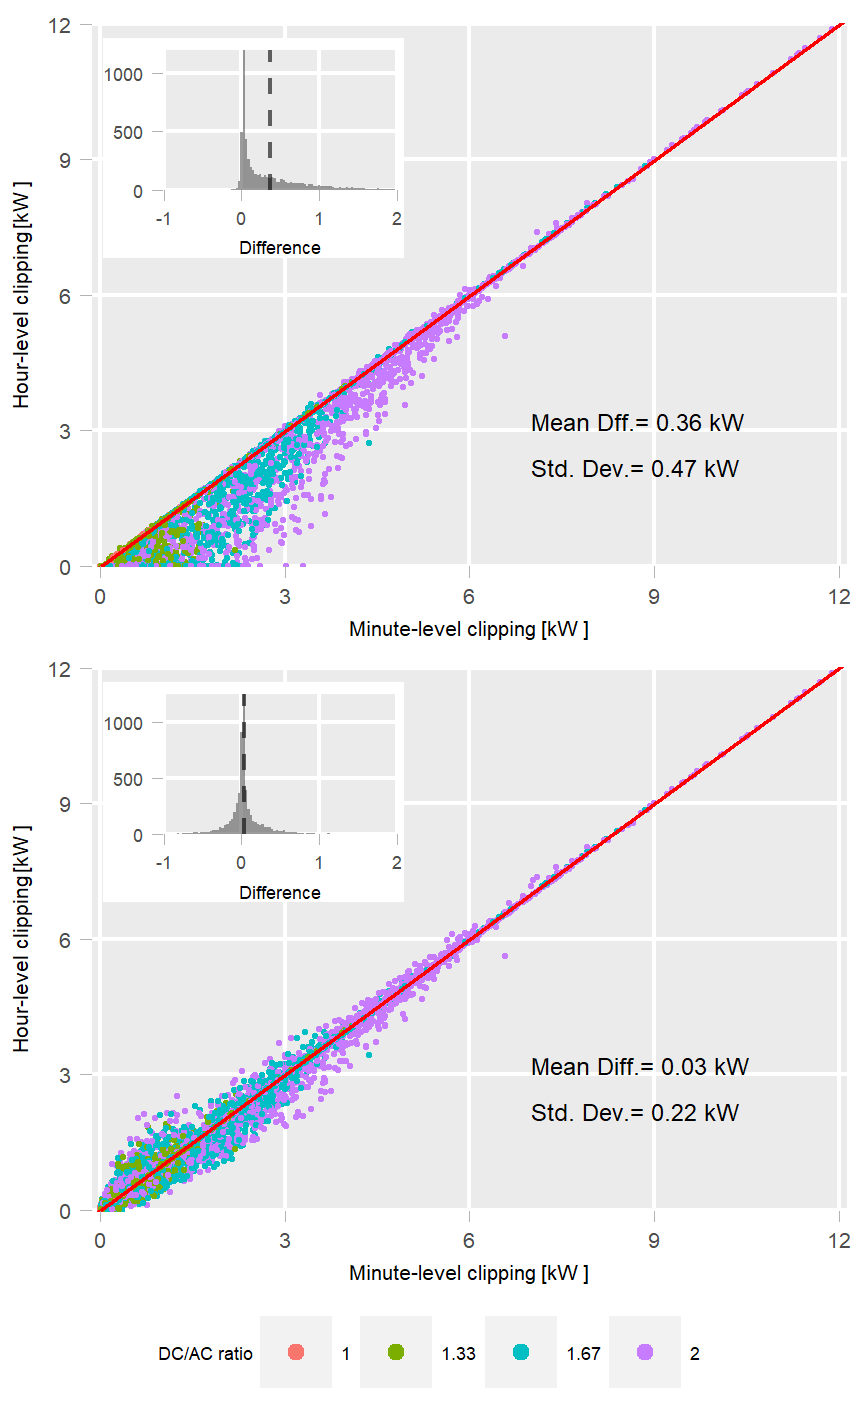
While the approximation for each hour may be rudimentary, it is more robust at the scale of a full simulation. The mean bias error in the clipping loss evaluation is indeed strongly reduced. In the figure below, we compare the clipping evaluation without correction (top) to the one with correction (bottom).
Updates
PVsyst 8.0 implementation
In PVsyst 8.0, the model could only be applied when using an hourly MET file that had been generated using sub-hourly irradiance data. These MET files could be generated using the custom weather import: a checkbox allows one to choose to generate a compatible MET file.
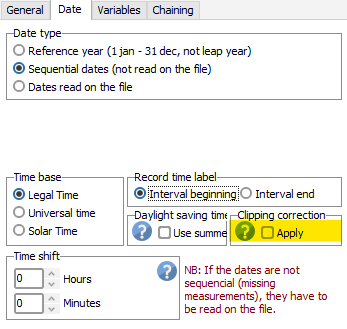
The compatible MET files are marked as containing the statistics necessary to use the clipping correction. These MET files can be used in any variant and any PVsyst version from 8.0 onwards. The clipping correction will be automatically used whenever it is applicable during simulation.

-
A. Villoz, B. Wittmer, A. Mermoud, M. Oliosi, and A. Bridel-Bertomeu. A model correcting the effect of sub-hourly irradiance fluctuations on overload clipping losses in hourly simulations. 8th World Conference on Photovoltaic Energy Conversion; 1151-1156, 2022. doi:10.4229/WCPEC-82022-4EO.2.2. ↩