Inverter Pnom as f (voltage)
Inverter specification
Some manufacturers now specify a nominal power curve (Pnom) as a function of input voltage.
These curves look like the following blue curve:
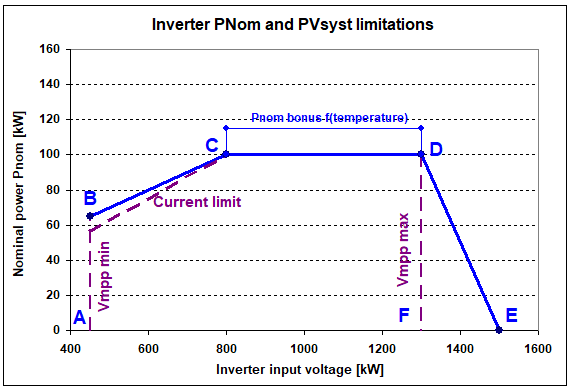
The plateau C - D is the nominal power PNom. Here we have chosen 100 kW, so that you can interprete the Y-axis either as Powers, or as a percentages of P / Pnom (100%).
The additional value between C and D represents possible bonus power when inverter temperature is favorable (up to PMax in PVsyst).
The voltage at the point D corresponds to the Maximum Operating Voltage, named VmppMax in PVsyst.
A linear decrease occurs from point D to E, where E is typically the maximum allowed input voltage (VAbsMax in PVsyst). In most actual specifications, the VmppMax/VAbsMax ratio is approximately 85%.
At low voltages, segment B-C represents input current limitation. This can be verified from specified values: current at point C (I(C) = PNom(C) / V(C)) equals (or closely matches) current at point B (I(B) = PNom(B) / V(B)).
Point B voltage is the minimum voltage VmppMin, and point C is the "minimum voltage for PNom" specified in PVsyst.
Power limitation
For actual inverters, when an I/V curve is applied: if Pmpp exceeds the PNom curve, the inverter shifts the operating point toward higher voltages until reaching authorized power (the I/V curve and blue curve intersection).
In the PVsyst simulation, the behaviour is the same, except that the limiting values will be the violet dotted curves.
During the simulation, the Overload loss will be the difference between the Pmpp and the power of this intersection point.
All I/V curves with a Pmpp within these limits will not lead to any overload losses.
High voltages
Let us study the effect of the I/V curve of the PV array.
The diagram shows an I/V curve with power overload at the highest practical voltage for the PV array. This voltage is limited by Voc at the operating array temperature.
Two factors contribute to temperature evaluation at high operating power:
- First, we use a reference low temperature (the site's minimum ambient temperature) to evaluate maximum possible Voc. In this example, operating temperature is assumed at least 10°C above minimum, reasonable for high-power operation.
- During solar operation, the PV array heats. Under 1000 W/m² with a heat loss factor Uc = 29 W/m², temperature increases approximately 25°C.
Thus, there is at least a 35°C difference between the lower reference temperature (at which Voc ≤ VAbsMax) and operating conditions. With a typical muVco coefficient of -0.3%/°C, the minimum Voc voltage drop is: Voc(TMin) × muVoc × (Toper - Tmin) = 158 V.
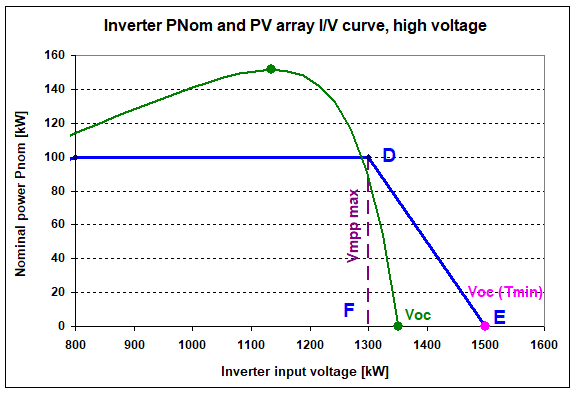
The operating point is the intersection of the falling edge of I/V curve and the PNom limit.
If this is below thepoint D, no problem, the overload is calculated correctly as the difference between Pmpp and PNom.
If the I/V curve passes on the right of the point D:
- In PVsyst, there is no possible operating point, the inverter has to stop (the output will be null).
- In the situation of inverter's specification, the operating point would be the intersection of the I/V curve and the segment D-E. We could recover a part of the power.
This situation is identified in PVsyst, by a warning message for each time step when this arises. In the great majority of well-sized systems, this never arises, so that this D-E specification has no effect.
Low voltages
When the overload arises at lower voltages than the operating point (intersection) may be:
- either on the Pnom horizontal line, this case is correctly treated in PVsyst, and leads to a usual Power overload loss
- or on the B-C segment.In this case PVsyst treats the power loss (difference between Pmpp and operating point) as a "maximum current loss". We can see that the difference between the PVsyst normal behaviour and the specification is insignificant close to the point B, and may increases when the voltage diminishes and the specification is not representative of a constant current limit.
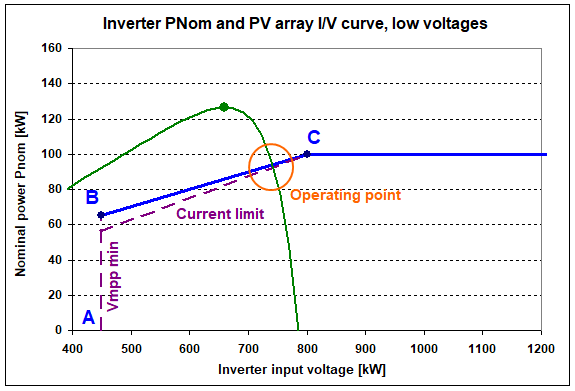
We will adapt the PVsyst simulation behaviour in the future. But this is not in our priorities as the effect on most simulations is marginal.