|
<< Click to Display Table of Contents >> Graphs and Tables |
  
|
|
<< Click to Display Table of Contents >> Graphs and Tables |
  
|
(go directly to our Notes on Meteo)
Graphs of hourly values
Graphs can be obtained as time evolution (selected periods), values distribution histograms or sorted values (cumulated histograms).
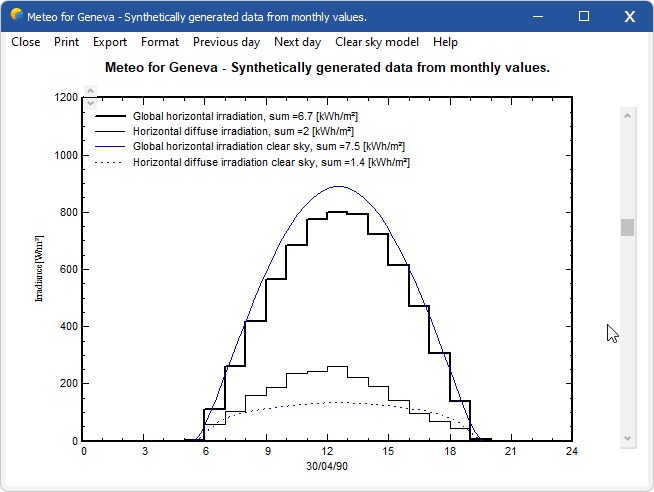
In the "Graph" tab, please choose "Hourly", "Global" and "Diffuse" (default when entering), and click the button "Graph". This will open a graph with the hourly meteo values, and you can walk through your entire data using the Scrollbar on the right.
This dialog also includes a specialized tool for checking of the quality of the hourly meteo data. The plot includes a blue line, which represents the Clear day model, superimposed on your data. Please observe a good day: it is very important that the data should be more or less centred on the blue line. This will always be the case for the synthetic data or the data imported from known sources using the "Import meteo data" PVsyst tool.
But this may be different with personal imported data, when using the "Import ASCII meteo files" tool. If the data are not matching the Clear day model (i.e. are shifted toward morning or evening), this indicates that the hour stamps of your data don't match the PVsyst standard, and all the models using solar geometry will not work properly.
When walking through the year, you will observe that clear conditions correspond to low diffuse component, and when the sun becomes hazy, the diffuse part increases. The difference between the global and the diffuse corresponds to the beam component.

Graphs of daily values
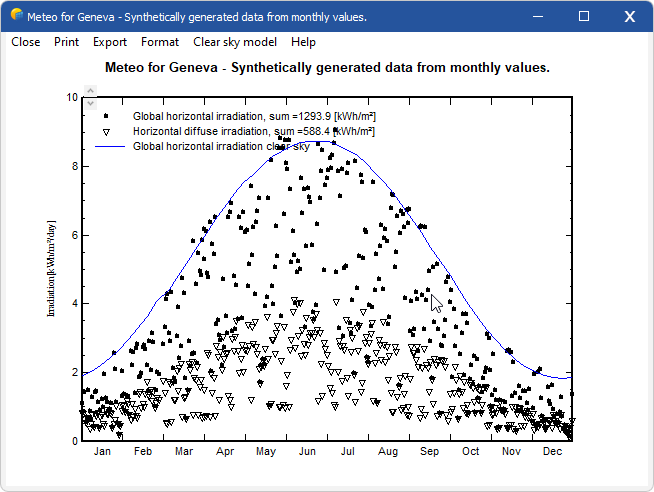
Have a look on the daily values. Each point represents the daily irradiance of one day, in [kWh/m²/day], along with the Clear day model as an envelope curve.
This plot gives a first check of the quality of the data. Now if some data significantly overcome the clear day model (say, by more than 3-5%), this indicates that the data are not good.

Tables of Hourly, Daily or Monthly values
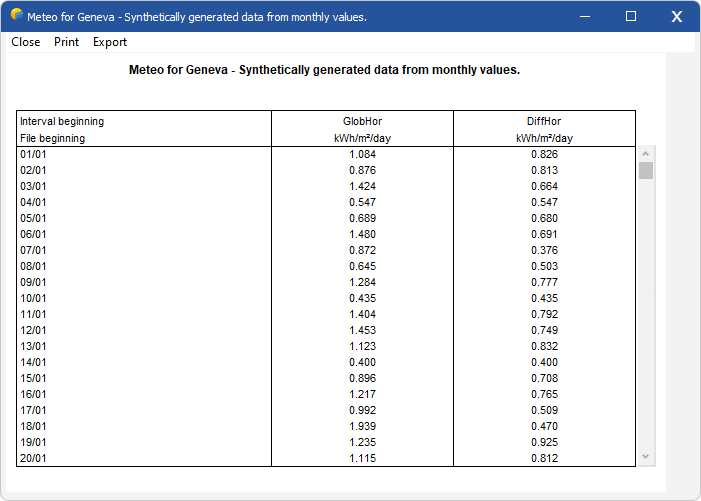
Tables display hourly, daily or monthly values in a scrolling mode. Printings or data export (using clipboard as well as ASCII file) can be easily performed for any time period, allowing the use of these data in other software.
Perhaps you also want to show your data as tables. You can choose up to 8 values to be tabulated at a time, including the irradiance on a tilted plane (transposition model) or the normal beam component (for concentration).
As for each data table in PVsyst, you have the opportunity of:
| - | Printing the table: this printed form usually includes the main parameters concerning the data, and for big tables (hourly or daily) you can choose the desired period. |
| - | Export / Copy as text: this will "copy" the full table in the clipboard, so that you can directly "Paste" it into an external spreadsheet (like msExcel). Please remember: in msEXCEL, the imported data will usually be gathered in one column only. To expand the data to the cells you have to use the standard EXCEL options for importing data: menu "Data" / "Convert…", and here you should choose "Delimited" / "Semicolon" separator. |
| NB: | The data will be copied with a decimal point. If you are using decimal commas (international preferences in Windows), you will perhaps have to change all points into commas. |
| - | Export / Copy as image: to be used to directly insert the table "as such" in a report. |
| - | Export / Copy to file: will create a CSV file, which you can open in any spreadsheet program. |
