|
<< Click to Display Table of Contents >> Meteonote6: Hourly data quality check |
  
|
|
<< Click to Display Table of Contents >> Meteonote6: Hourly data quality check |
  
|
The quality of the meteo data records is not always perfect, and may show several distortions due to sensor accuracy, data recording or processing, etc.
In particular when importing custom data, you are advised to carefully check the resulting imported data.
The main characteristics to be checked are:
- The time stamps of each record.
- The absolute values (sensor calibration, units, etc),
- The aberrant values (especially with respect to the clear day model)
PVsyst offers several tools for analysing this quality, located in the meteo hourly data visualizing tool "Meteo Tables and Graphs".
Graphs in hourly values
This is the first visual rough test to be performed.
When comparing the measured values with the clear day model drawn in blue (especially by choosing the best days), you will immediately identify the main possible errors:
- Time shifts of more than half-an-hour,
- Irradiance amplitude for best clear days,
- Aberrant values like night significant values or 'holes' in the data.
This test may be completed by a look on the graph in daily values, for which the data of best days should be close to the clear day model, and never overcome it by more than, say, 5% to 10%.
Check Data Quality tab
This option directly shows a graph of the time shifts of the best clear day for each month.
This allows to identify:
- a systematic time shift in the imported data. Tthis may be corrected in the meteo file (you should define a Time Shift correction).
- a variation of time shifts along the year, which may be due to:
- summer/winter time (or daylight saving time, DST) in the original data; the importing tool allows for taking the summer/winter hour changes into account, but the resulting meteo file will always be in winter time. PVsyst doesn't support DST.
- records defined in Solar time (very rare option, sometimes used for research time series),
- a misrunning of the clock of your recording equipment, leading to random time variations along the year; In this case PVsyst cannot help, the time Shift correction is only defined as constant over the year.
There are 3 further useful graphs:
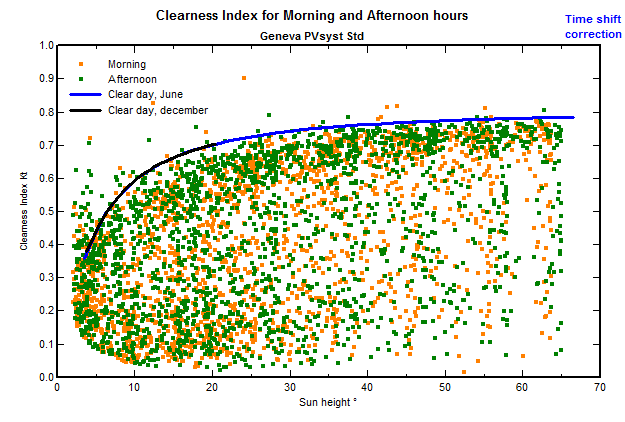
Hourly Kt morning/evening, which represents the hourly measurements of morning and evening Kt values in different colors.
- This is a very sensitive test for the real time shift of your data: a scrollbar allows to modify the time shift value, resulting in very dissymmetric distributions between morning and afternoon points. The best timeshift is when the morning and afternoon top points are well balanced.
- This also shows how the absolute values of Kt match the Kt corresponding to the Clear day model, as a function of the sun's heigth.

Monthly best clear days shows the detail of each monthly best day data with respect to the the clear day model, sometimes explaining why the value in the first plot is not well aligned.
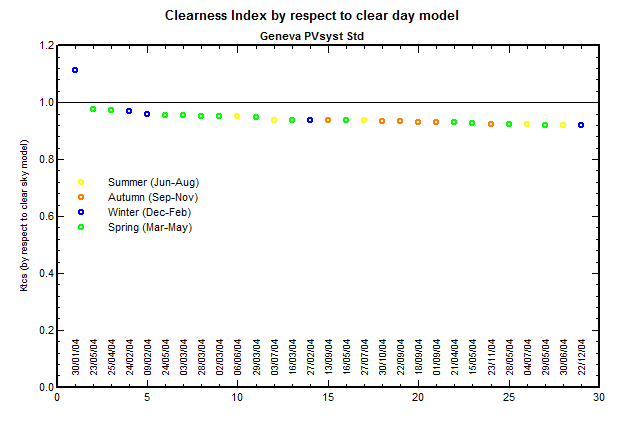
Best clear days Ktcc displays the sorted Ktcc of all days of the year. The Ktcc is the clearness index referenced to the clear day model (not to the extraterrestrial). This graph gives an idea of the calibration of the irradiance sensor: the best days of the data should be close (within 5%) of the clear sky model, i.e. Ktcc=1.
