Meteonorm data and program
Meteonorm
The Meteonorm1 software, API, and webapp (V3.0, 1997; V4.0, 2000; V5.0, 2003; V6.0, June 2007; V6.1, 2009; V7.0, 2012; V7.1 2015; V7.2 2017; V7.3 2019; V8.0 2020; V8.1 2021; V8.2 2023; V9.0 2025) provides monthly meteorological data for any location on earth.
Synthetic hourly and sub-hourly data can also be generated from monthly values using the Meteonorm algorithm included in PVsyst.
Finally, Meteonorm offers additional subscriptions and data. Data downloaded manually through the meteonorm portal (.csv or .dat files) can be imported via the known format import
Data overview
The data provided by Meteonorm contains:
- Global horizontal irradiance (GHI or GlobHor)
- Diffuse horizontal irradiance (DHI or DiffHor)
- Wind speed
- Temperature
- Relative humidity
- Linke coefficient
In the Meteonorm irradiance dataset, please note that :
- The effect of far shadings from mountains at sunrise and sunset is not included, which means that in mountainous regions an horizon mask, or encompassing 3D topographical data, must be further applied in the project definitions in PVsyst.
- Users of the Meteonorm1 software have the possibility to add a skyline profile before applying the [synthetic](synthetic-data-model.mdn, but it is not recommended to do so. Preferably the horizon mask should be added in PVsyst to ensure a correct transposition of diffuse onto the plane of array.
Data sources
This section give a brief overview of the Meteonorm data source, based on the Meteonorm V9.x help. Full documentation about the Software is also available from the Meteonorm web site.
Ground stations
The Meteonorm database contains thousands of weather stations and includes several international databases :
- Global radiation data is obtained from the GEBA Global Energy Balance Archive. Stations are retained based on careful quality and completeness criteria.
- Non-irradiance parameters, such as temperature, humidity, wind data, sunshine duration, and days with rain are now mostly based on the Global Surface Summary of the Day (GSOD) database from NOAA.
Based on these time series, monthly average weather data is then calculated for long-term periods. This data is blended spatially between stations and using gridded data.
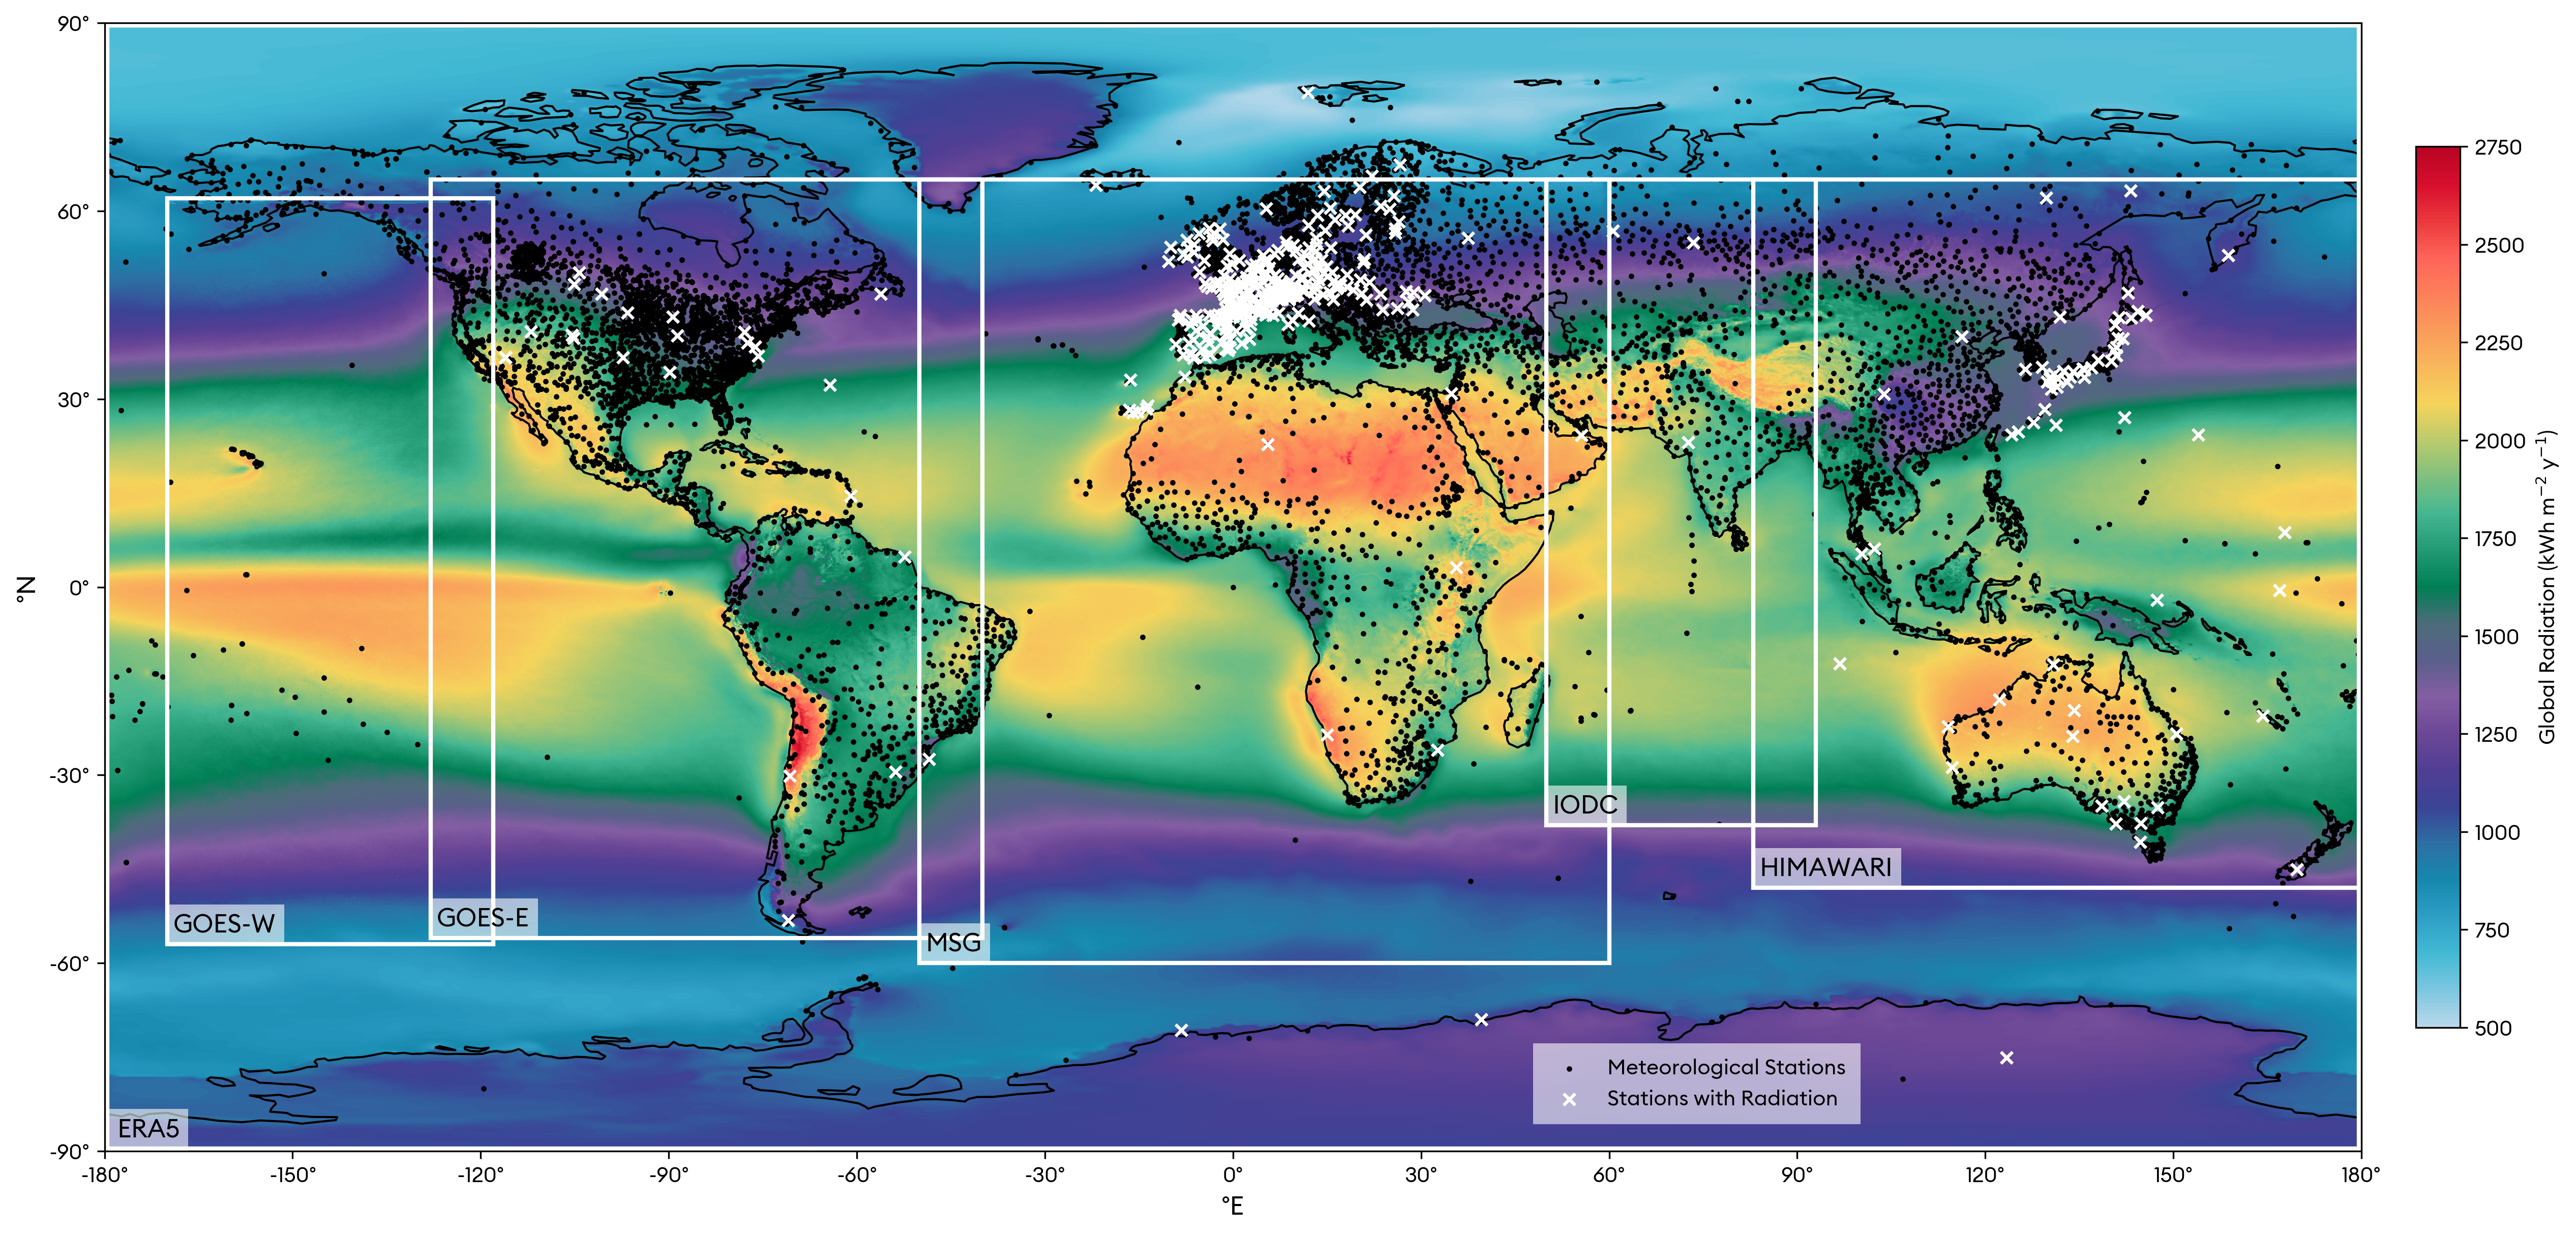
Satellite and gridded data
Satellite data is the main source for radiation in remote areas. As most weather data providers, the MSG, IODC, Himawari, GOES-East and -West are considered to obtain near-global coverage. The data is homogenized to the 2001-2020 reference period using ERA5 data and trusted ground stations. For regions outside this range, and missing weather variables, ERA5 reanalysis data is used.
Spatial blending
Where no weather data measurement is available in close proximity (2 km) from the selected location, data may be blended between stations, or with gridded data. The data that is ultimately blended depends in fact on the distance to the closest station. There are 4 ranges:
- Below \(d_1 =\) 2 km: nearest station only.
- Between \(d_1\) and \(d_2\): up to six stations are blended.
- Between \(d_2\) and \(d_3\): station and gridded data is blended.
- Above \(d_3\): gridded data only.
Distances \(d_2\) and \(d_3\) depend on the type of weather data, but are set respectively at 10 km and 50 km for radiation data.
The blending methodology is based on the inverse distance weighting (IDW) method. In addition to accounting for the altitude difference by means of a vertical gradient factor, the following averaging weight \(w\) is used:
where \(d\) is the horizontal distance to the target, \(R\) is the maximum search radius, \(v\) is the vertical scaling factor, and \(z-z_x\) is the difference in altitude to the target. \(R\) and \(v\) will depend on the kind of data that is being blended.
Synthetic generation
Based on the long-term monthly averages, a stochastic process is used by Meteonorm to obtain a higher frequency time series. Meteonorm TMY files are therefore different from those produced e.g. with the ISO 15927-4:2005 methodology or the TMY generation tool in PVsyst, yet they still remain representative of the long-term typical climate.
The process starts by generating a daily and then an hourly GHI time series. The daily series is generated based on a Markov model with transition probabilities. The hourly time-series is constructed with a Time-dependent Autoregressive Gaussian (TAG) model.
The next step is to generate secondary irradiance components, such as the DHI. Currently, the Perez et al., 19921 model is used for DHI (note that this work is often cited as the corresponding 1991 conference contribution).
Coming next are models for the ambient temperature, with the monthly values and GHI time-series as inputs. The short time scale variations of other weather data parameters are modeled from GHI and temperature.
Finally, if minute-level data is required, the Remund model (Remund, 20162) is applied. For derived variables, such as DHI, note that the sub-hourly time series will lead to different results when averaged compared to hourly time-series results. GHI to DHI models do not generally commute with time averaging.
Usage in PVsyst
At site creation
When creating a new site, monthly data is retrieved and a synthetic data generation process is then run. Either hourly or minute weather data can be generated, based on the selected choice in a drop-down menu.
File import
Files generated via the Meteonorm software or web application can also be imported in PVsyst. Meteonorm is available among the known formats. This can allow to import different types of data, such as POA data, or actual meteorological years (AMY).
Synthetic generation from monthly data
The synthetic generation methodology can be used in PVsyst and be applied on any set of monthly weather data, whether or not it comes from the Meteonorm database.
Updates
Meteonorm 9
The full list of changes compared to Meteonorm 8 is available on the meteonorm website. Notable changes are:
- 2001–2020 is now the default climate period for radiation, temperature, and other meteorological parameters. Since the reference period is fixed, this information is not indicated in PVsyst 8.1 anymore.
- Topographical data is now based on the Copernicus GLO-30 and has a 30m resolution (instead of 90m).
- Updated satellite and station data.
Meteonorm 8
- More recent data from the following periods:
- 1996–2015: new main period for radiation parameters.
- 2000–2019: new main period for temperature, dew point temperature, wind, precipitation and days with precipitation.
- This recent time period is denoted in the new Version as “contemporary”. It is still possible to choose a “historic” data period (1981–1990 for radiation and 1961–1990 for temperature).
- Database:
- Access to ongoing current time series based on satellite worldwide (55°S to 65°N) and Re-Analysis data (ERA-5T) for the rest of the world.
- New satellite data: Now based on an own, globally homogeneous satellite model (Schmutz et al.,2020), including satellite data for Asia and the Americas.
- Future data for IPCC Scenarios RCP 2.6,4.5 and 8.5 from 10 global climate models based on CMIP5 are included.
- Models:
- Detailed model for urban effects based on the H2020 climate-fit.city project. 100 cities in Europe include urban effects for the contemporary climates. Barcelona, Berlin, Bern, Bremen, Prague, Rome and Vienna additionally include urban effects of 2050 for two scenarios.
Meteonorm 7.3
- Database:
- Update of precipitation and days with precipitation to the period 2001–2015.
- Update of the solar resources in Brazil.
- Access to ongoing current time series based on satellite (Europe, Africa, Near East) and Re-Analysis data (ERA-5, rest of the world).
- Models:
- Detailed model for urban effects based on H2020 climate-fit.city project for Barcelona, Bern, Rome and Vienna (more cities will follow in ongoing patches).
- New Solis 2017 clear sky model (Ineichen, 2018).
Meteonorm 7.2
- Database:
- Update of the time periods for temperature, humidity, precipitation and wind speed: periods 1961–1990 and 2000–2009; for radiation parameters 1981–1990, 1991–2010 and 1996–2015.
- Update of the satellite database. Satellite maps based on 5 geostationary satellites has been updated and enhanced – especially for areas with high albedo.
- New turbidity climatology based on Gueymard (2012).
- Models:
- New models for calculation of one minute radiation data.
version 7.2 vs 7.3
Compared to version 7.2, Version 7.3 includes no access to ongoing hourly timeseries and includes detailed urban heat models for Barcelona, Bern, Rome and Vienna.
- Database:
- Update of precipitation and days with precipitation to the period 2001–2015.
- Update of the solar resources in Brazil.
- Access to ongoing current time series based on satellite (Europe, Africa, Near East) and Re-Analysis data (ERA-5, rest of the world).
- Models:
- Detailed model for urban effects based on H2020 climate-fit.city project for Barcelona, Bern, Rome and Vienna (more cities will follow in ongoing patches).
- New Solis 2017 clear sky model (Ineichen, 2018).
version 7.1 vs 7.2
Compared to version 7.1, Version 7.2 includes updated meteorological and turbidity data and additional features.
- Database:
- Update of the time periods for temperature, humidity, precipitation and wind speed: periods 1961–1990 and 2000–2009; for radiation parameters 1981–1990, 1991–2010 and 1996–2015.
- Update of the satellite database. Satellite maps based on 5 geostationary satellites has been updated and enhanced – especially for areas with high albedo.
- New turbidity climatology based on Gueymard (2012).
- Models:
- New models for calculation of one minute radiation data.
-
Richard Perez, Pierre Ineichen, E. L. Maxwell, R. D. Seals, and A. Zelenka. Dynamic global-to-direct irradiance conversion models. ASHRAE Transactions, 98:354–369, 01 1992. ↩↩↩
-
Jan Remund. Generation of one minute data. 6th PV Performance and Monitoring Workshop in Freiburg, Germany, 2016. doi:10.13140/RG.2.2.34551.21924. ↩