Check data quality
Weather data records may contain distortions due to sensor accuracy, data recording, or processing issues. This is especially true when importing custom data — careful quality checking is an essential step towards reliable simulation results.
The main points to check are:
- The time stamps and time shift
- The absolute values (sensor calibration, units, etc.)
- The aberrant values, especially with respect to the clear-sky model
PVsyst offers several tools to check weather data quality. During the custom import process, advanced checks are run and data should be reviewed at import time. For other cases, any .MET file can be visualised and inspected using Weather Data Tables and Graphs.
The available control plots are:
- the time shift of monthly best days with respect to the clear-sky model (available on the
Check data qualitytab) - the cloud of hourly Kt in the morning and evening (with the option to apply a time shift correction)
- the daily irradiance profile of monthly best days, compared against the clear-sky model
- the ranking of days by clearness index
Note that errors from a wrong horizon parametrisation will not be visible here. Please read the note on horizon in *.MET files.
Graphs tab
This tab allows you to plot any variable in your .MET file as sub-hourly, hourly, daily, or monthly values. It is a good starting point for inspecting your data.
Comparing measured values against the clear-sky model (drawn in blue), particularly for the best days, will quickly reveal the main errors:
- Time shifts of more than half an hour
- Incorrect irradiance amplitude on clear days
- Aberrant values such as significant night-time values or gaps in the data
The daily-value graph is also useful: best-day values should be close to the clear-sky model and should not exceed it by more than 5–10%.
Tables tab
This tab displays any variable in your .MET file as hourly, daily, or monthly values in a table. Tables can be exported as .csv files if needed.
Tables are particularly useful for identifying missing values. If GHI (GlobHor) is missing during daytime, the affected rows will be marked as invalid (yellow). Incomplete .MET files are not recommended for use in simulations.
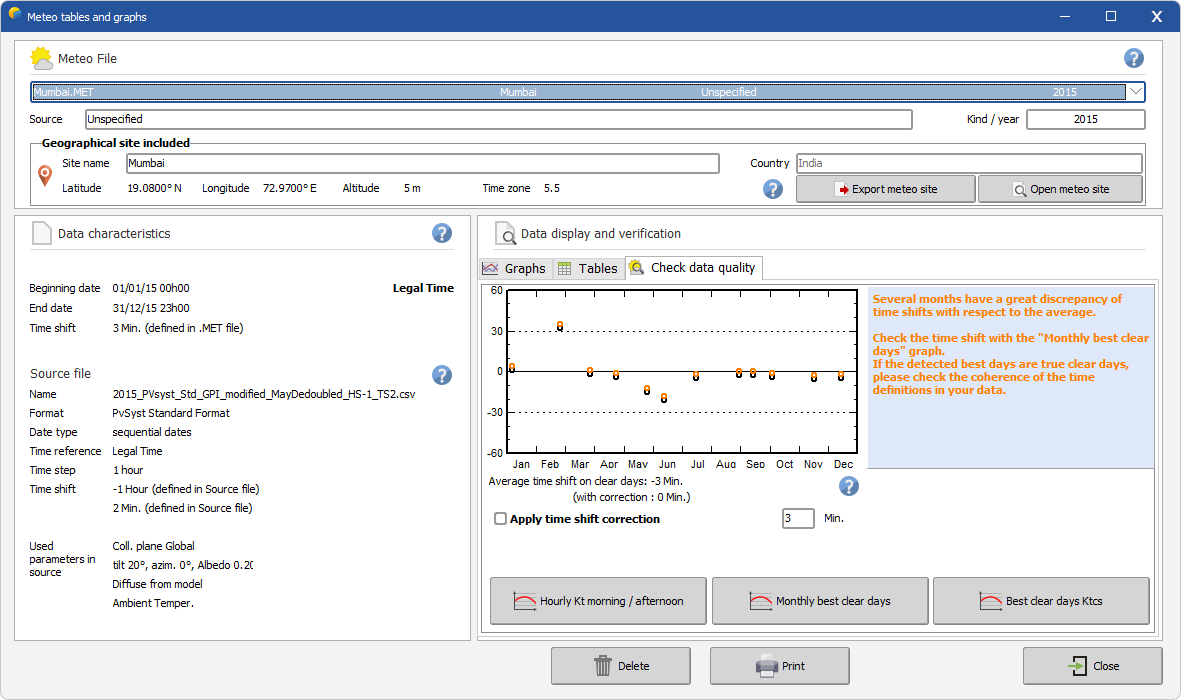
Check Data Quality tab
This tab displays a graph of the time shift of the best clear day for each month.
It allows identification of:
- A systematic time shift in the data. This can be corrected in the weather data file by defining a Time Shift correction.
- A variation of time shift throughout the year, which may be due to:
- Summer/winter time (DST) in the original data. The import tool can account for DST changes, but the resulting
.METfile is always stored in winter time — PVsyst does not support DST. - Data recorded in Solar time (rare, sometimes used in research datasets).
- A drifting clock on the recording equipment, leading to irregular time variations. In this case PVsyst cannot help, as the time shift correction is defined as a constant over the year.
- Summer/winter time (DST) in the original data. The import tool can account for DST changes, but the resulting
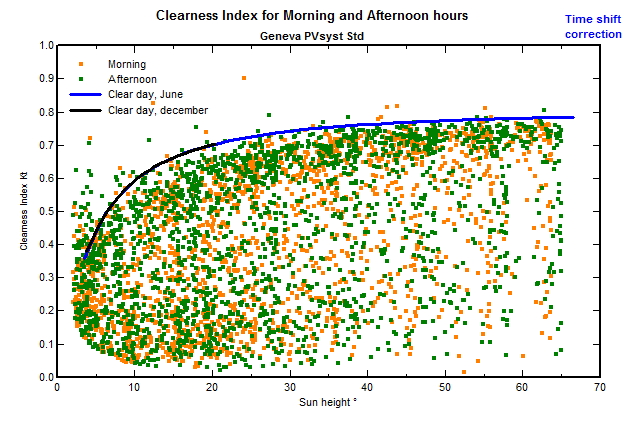
Hourly Kt morning/evening
This plot shows hourly Kt measurements for morning and evening separately, in different colours.
- It is a sensitive test for the real time shift of the data: a scrollbar lets you adjust the time shift value, which shifts the morning/afternoon distribution asymmetry. The optimal time shift is reached when the morning and afternoon peak values are well balanced.
- It also shows how the measured Kt values compare to those of the clear-sky model as a function of solar elevation.
Monthly best clear days
This plot shows the detailed hourly profile of the best day in each month, compared against the clear-sky model. It can explain discrepancies seen in the time-shift graph above.
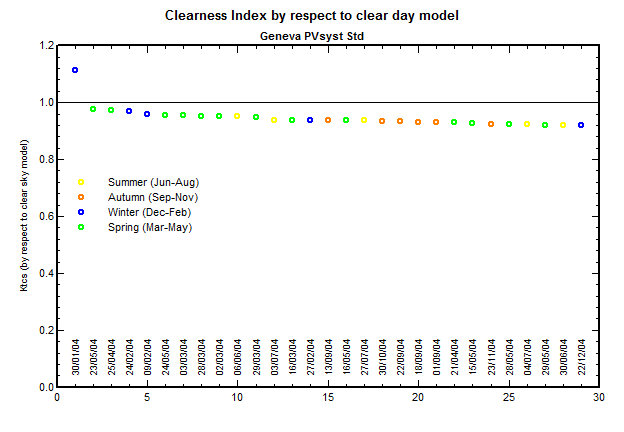
Best clear days Ktcc
This plot shows the sorted Ktcc values for all days of the year. Ktcc is the clearness index referenced to the clear-sky model (not to the extraterrestrial irradiance). It gives an indication of the calibration of the irradiance sensor: on the best days, Ktcc should be close to 1, i.e. within 5% of the clear-sky model.