Interannual variability
The solar resource at any given location fluctuates from year to year. The distribution of annual irradiation values over a sufficiently long record (typically 10–30 years) is well approximated by a normal (Gaussian) distribution, characterised by a mean value and a standard deviation (σ). This standard deviation, expressed as a percentage of the long-term mean, is referred to as the interannual variability or year-to-year variability.
The annual variability value is used in the P90 calculation.
Computation
In PVsyst, there are several ways to obtain the interannual variability:
- For geographical sites created with Meteonorm, the annual variability is provided by Meteonorm and displayed next to the monthly weather data.
- When generating a TMY in PVsyst, the annual variability will be saved in the .MET file and used automatically in the P90 computation.
To compute the variability for the location of your choice, you can:
- Import a multi-year time series (e.g. using the PVGIS known format)
- Compute the variability of your data set using the weather comparison tool
Databases > Compare Weather data. The years to be included can be selected, and the "Histo and probabilities" option displays the corresponding distribution plot.
Default value
If no year-to-year variability is present in the site or weather file, PVsyst proposes a default annual variability when computing the P50-P90.
The default value comes from a simple linear model fitted on GHI measurements from the Global Energy Balance Archive 1.
The fit corresponds to the following variability values:
- Variability at 900 kWh: 5.1 %
- Variability at 1700 kWh: 3.5 %
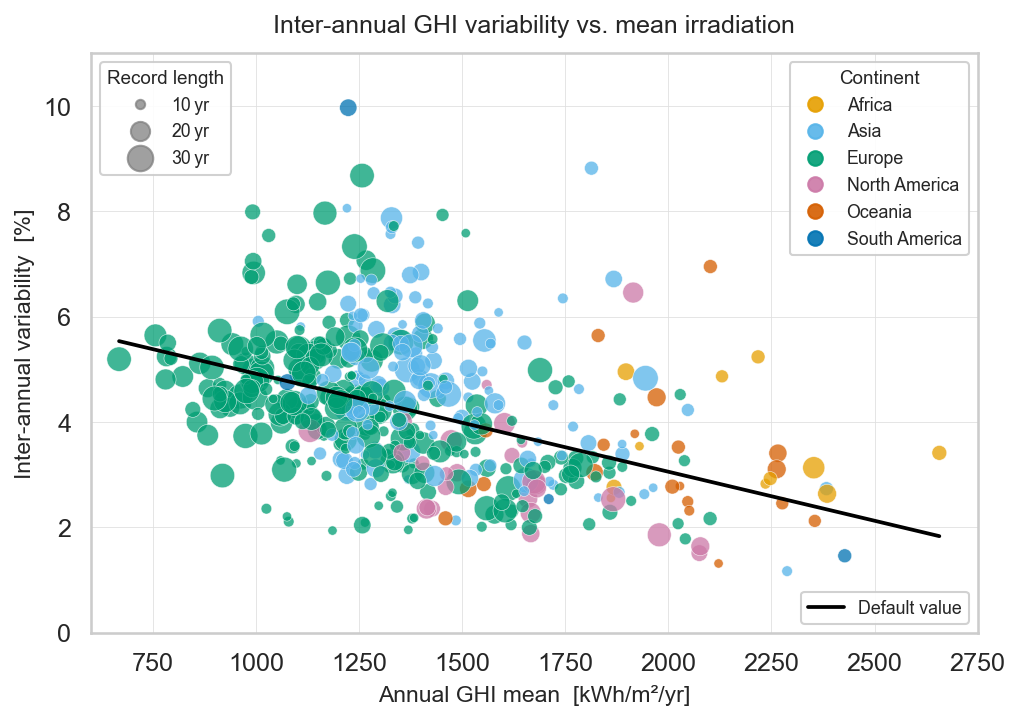
Figure 1: Scatter plot showing interannual variability as a function of average irradiance and the PVsyst default value. The data used for this study come from the Global Energy Balance Archive 1.
Please note that typical variability values can differ significantly from the model, and it is advised to compute the variability for your location of interest.
Updates
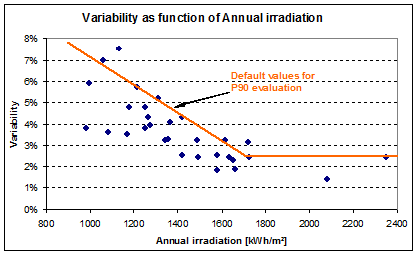
Until PVsyst 8.1.4, the default variability value was based on P. Ineichen's results2 as shown below. The default value was 2.5% for sites with a yearly global horizontal irradiance of 1700 kWh/m2/year or more. Below that threshold, the annual variability was considered linearly dependent on the global irradiance, with 8% variability at 900 kWh/m2/year.
-
Wild et al. The global energy balance archive (geba) version 2017: a database for worldwide measured surface energy fluxes. Earth System Science Data 9, 601–613., 2017. URL: https://doi.org/10.5194/essd-9-601-2017. ↩↩
-
P. Ineichen. Global irradiation: average and typical year, and year-to-year variability. Research report, Institute of Environmental Sciences, University of Geneva, 2011. URL: http://cuepe.ch/html/biblio/pdf/Ineichen_2011-global_irradiance_typical_year_and_annual_variability(swc).pdf. ↩