|
<< Click to Display Table of Contents >> Ageing Tool |
  
|
|
<< Click to Display Table of Contents >> Ageing Tool |
  
|
Overview
This tool describes the performance evolution of your PV system along the years, when taking the PV modules degradation and the increasing mismatch into account.
For the moment this tool is only available for Grid-connected systems.
This analysis may be performed:
- either from a single meteo data file (usually the meteo source of your project), which should ideally be an "average" or TMY year.
- or, if you avail of meteorological data for a series of years, it may be applied to each real meteo data file for the series years. This may be useful for analyzing the historical evolution of an existing system, with the real data.
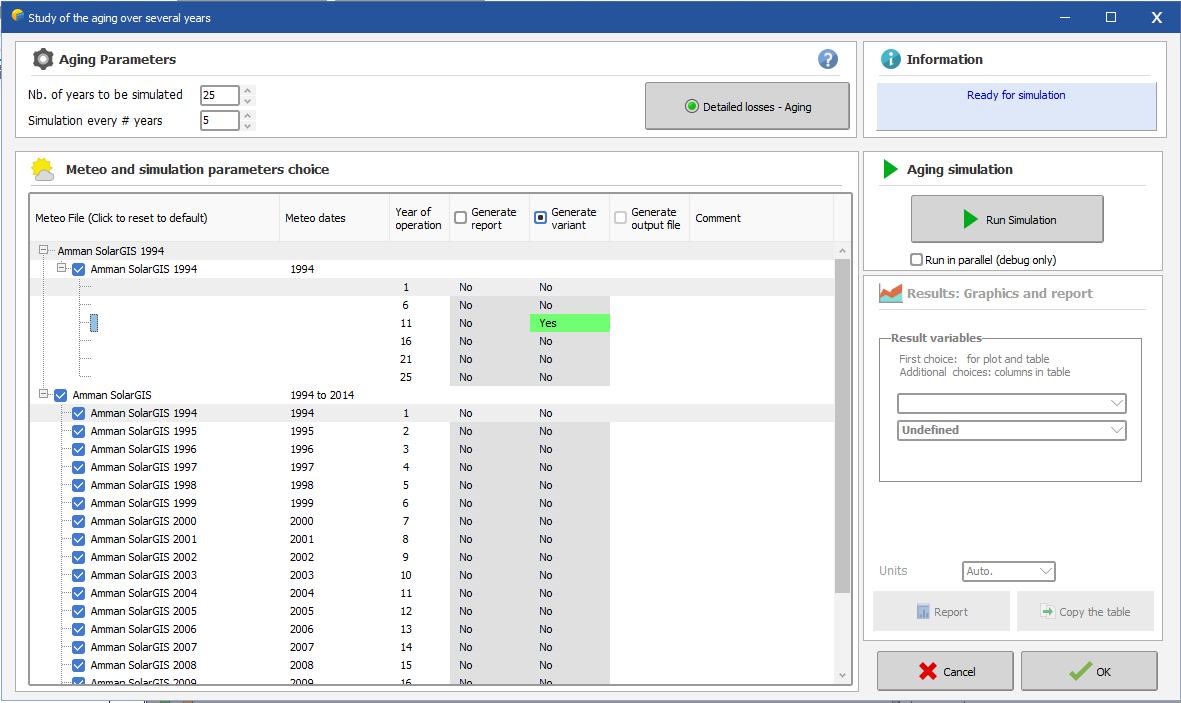
With a single meteo data file, simulating all the years is not necessary: you can simulate some years, and interpolate between these simulations. ,
Procedure
This tool is an addition to a "normal" simulation: it is only available when the simulation of your project has been successfully done.
Therefore if you change a parameter in your simulation, this tool will be erased, you will have to re-simulate it with the new parameters after performing the new simulation
When entering this tool, the blue panel (top right) will indicate what to do.
| 1. - | You have to define the basic degradation parameters (module degradation rate, mismatch evolution). If you have already defined the degradation in the "detailed losses" of your main simulation, this will take these parameters as initial values. But you can define any other ones for this tool. |
| 2. - | A tree view will show all the available meteo data files available in the vicinity of your project. There may be single generic files, or series of yearly meteo data. Note that only the files containing a full year of data are available here. |
| 3. - | You should select the meteo or groups of yearly meteo that you want to simulate. It is possible to simulate up to 2 groups at a time. |
| 4. - | With single meteo files, you may specify the total number of years to be analyzed, as well as the time interval between the simulations really executed. The intermediate years will be interpolated. |
| 5. - | It is possible to create specific variants, generate reports or generate the hourly output files (if available in the original simulation) for chosen simulations. For this simply click on the corresponding cases in the table.. |
| 6. - | When everything is ready, click on "Run simulation". |

Results
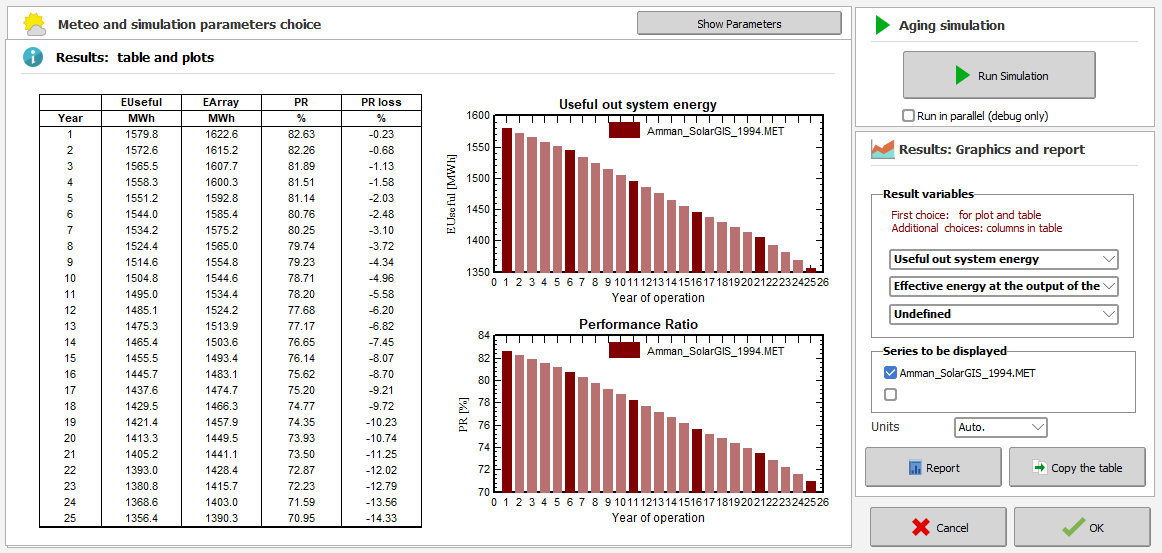
After the simulation you directly obtain the results, as a table and 2 graphs.
You can choose the variable to be shown on the first graph The second graph will always show the evolution of the PR.
Besides the PR and its loss percentage evolution, you can get up to 3 chosen variables on the table.
All these results will be shown on the report (2 pages).
Export: The button "Copy the table" allows to paste the table directly in EXCEL.
NB: it is always possible to retrieve the input parameters by clicking the button "Show parameters".
