Step-by-step procedure for developing a pumping system
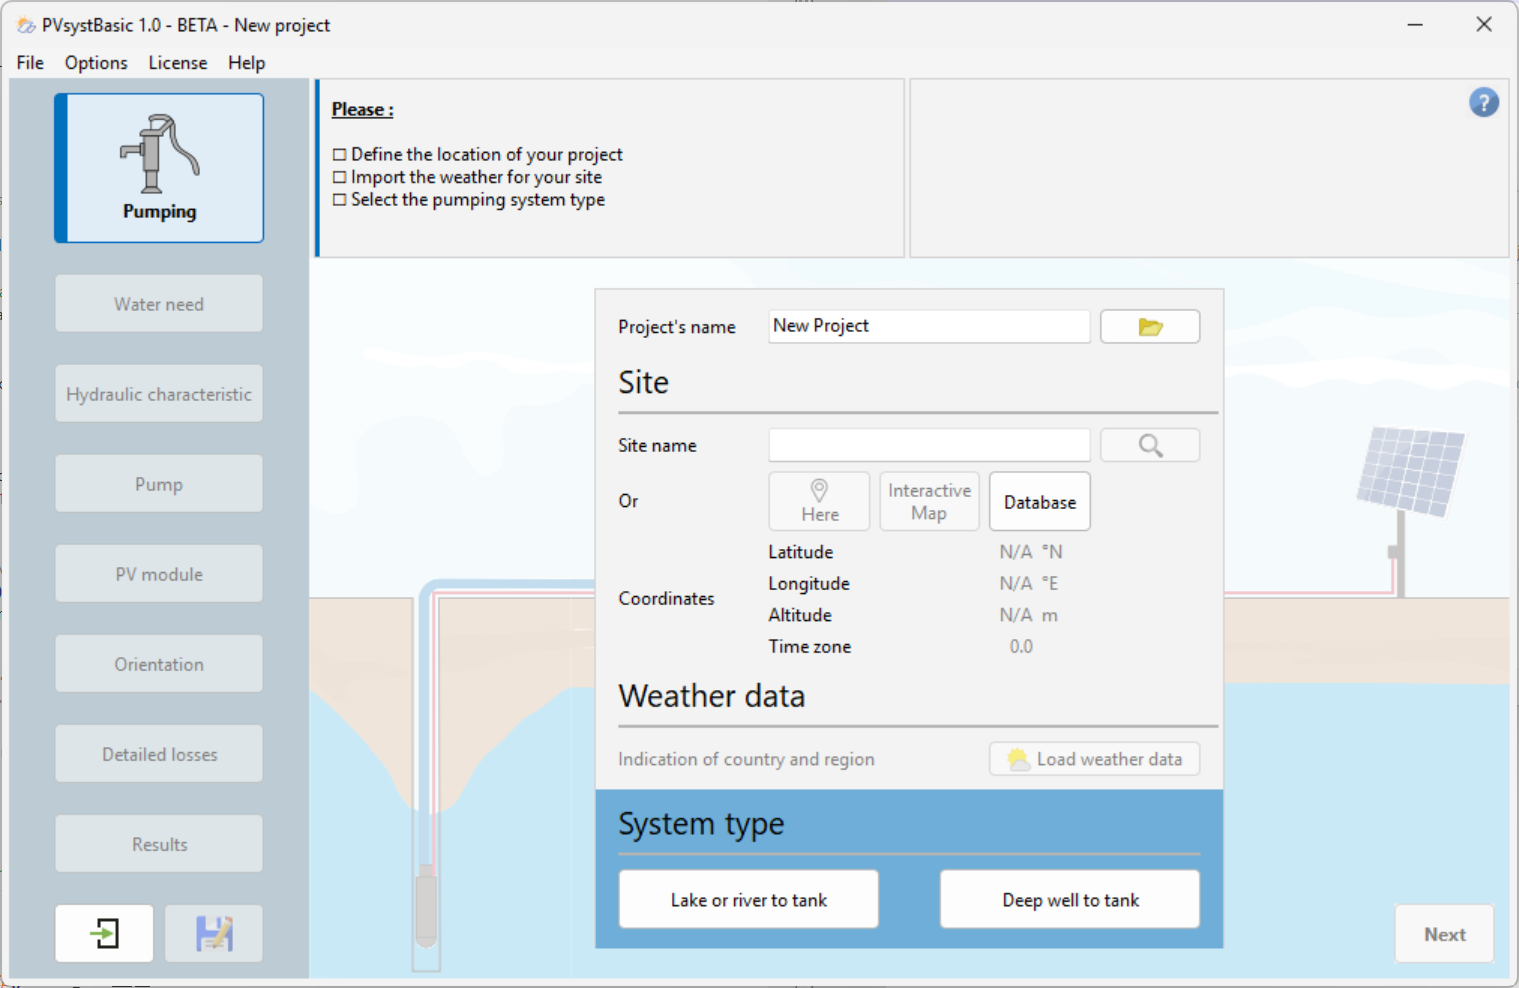
Project
To start a project, you must:
- Define the project name
- Define the site name, or click the "here" button to geolocate yourself, or choose a site from the "interactive map," or search for a preloaded site by clicking "Database"
Once the site is defined, you must click the "Load Weather" button to import weather data.
You must choose the type of system you wish to simulate from two options:
- Lake or river to reservoir
- Well to reservoir
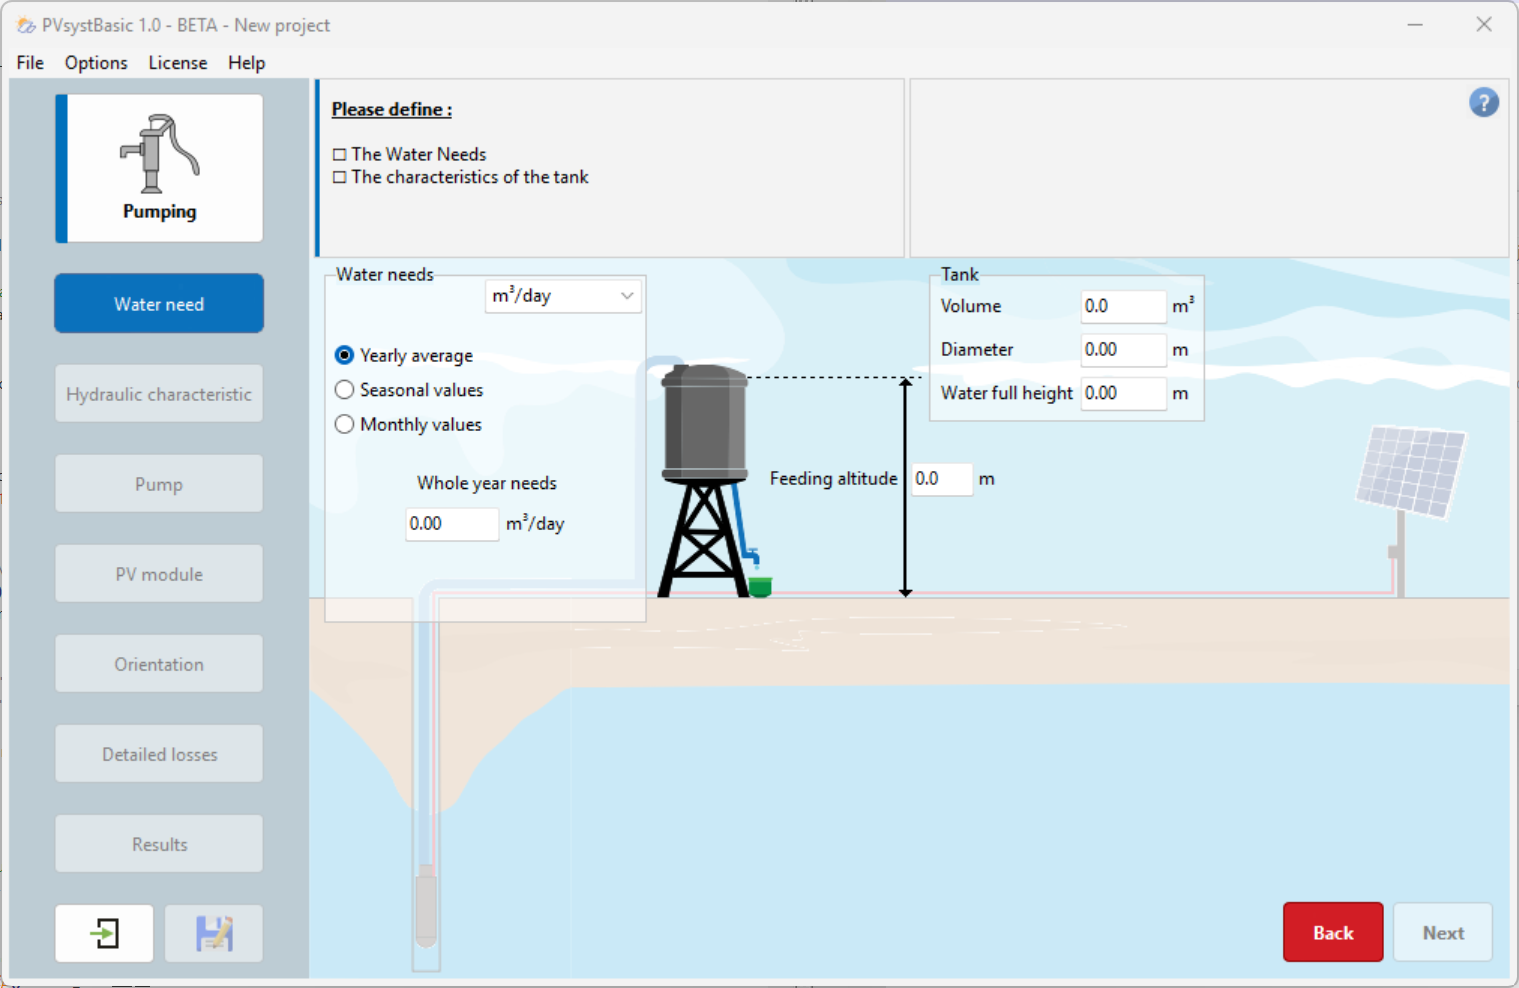
Water Demand
In this window, you must define the following elements:
- Water requirements (volume of water pumped) can be defined on an annual basis (constant value) or based on monthly or seasonal values. It is not relevant to specify requirements on an hourly basis (daily distribution), as the pumping system generally includes sufficient storage for at least one day’s consumption
- Reservoir:
- Volume
- Diameter
- Maximum height (full): this value is measured from the bottom of the tank, not from the natural ground level
- Injection altitude (particularly important if the reservoir is elevated, as it affects distribution pressure)
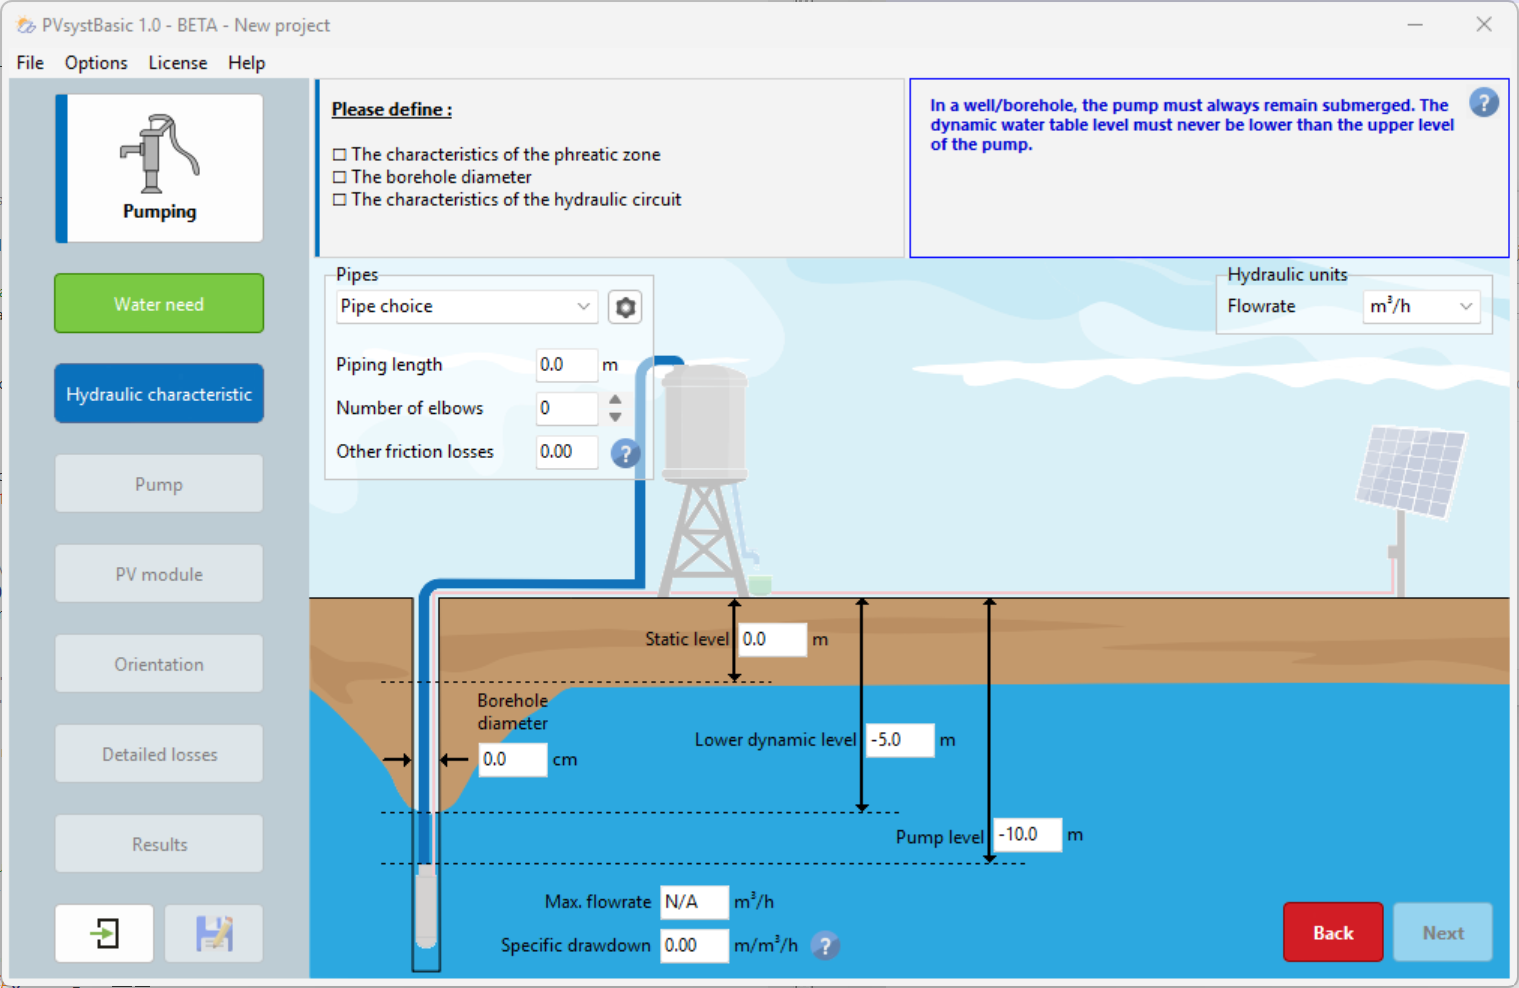
Hydraulic Characteristics
In this window, you must define the following elements:
-
Hydraulic Circuit:
- Choice of pipe type
- Pipe length
- Number of bends (can be left at "0" for the simulation)
- Other friction losses (can also remain at "0" for the simulation)
-
Well/Borehole Characteristics:
- Static level
- Drawdown or maximum flow rate (only one of these two values is required; the other will be calculated automatically by the software using the following formula): $$ \mathsf{Drawdown} = \frac{\mathsf{Lower~ dynamic~ level} - \mathsf{Static~ level}}{\mathsf{Max~ flow}} $$
- Minimum dynamic level (calculated by the software; if you change this value, it will automatically adjust the drawdown or maximum flow rate. The minimum dynamic level must always be higher than the static level)
- Pump level
- Borehole diameter (not used in calculations or simulations)
In PVsystBasic, levels and distances are always indicated relative to the natural ground (TG).
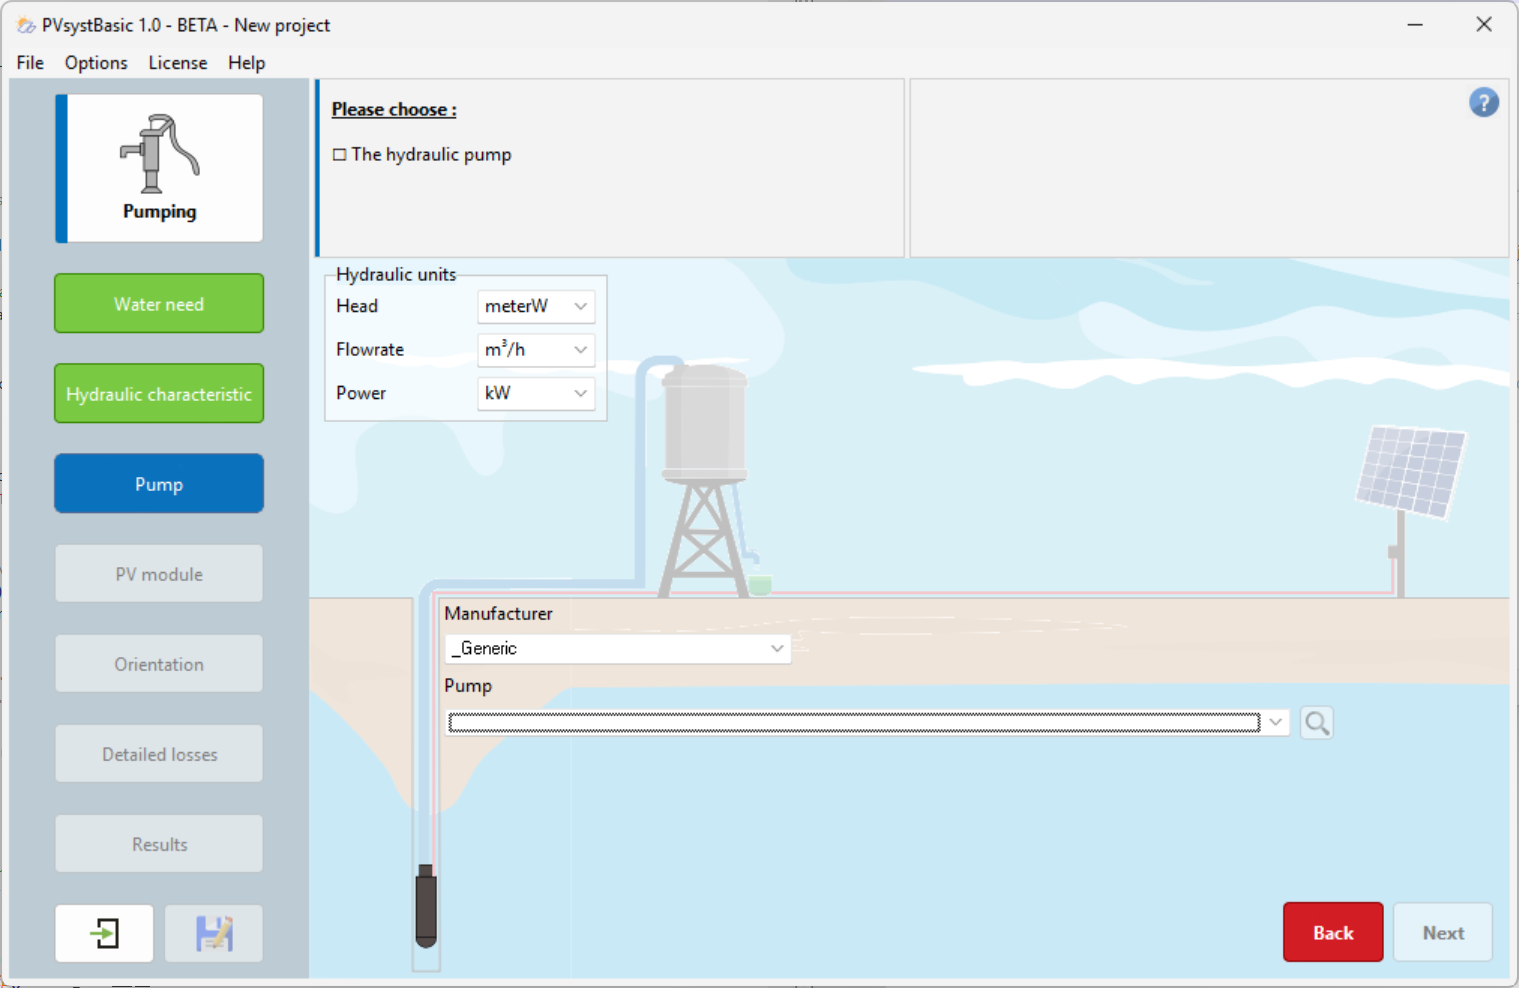
The pump
In this window, you will need to select the model for your system. Several pump manufacturers are already listed, offering you a choice among:
- Surface pumps
- Submersible pumps
- AC pumps
- DC pumps
- Etc.
To select the pump best suited to your system’s specifications, the software performs a preselection based on the following criteria:
- Minimum and maximum Total head (HMT)
- Flow rate
- Power
If the pump is incompatible (red) with your configuration.
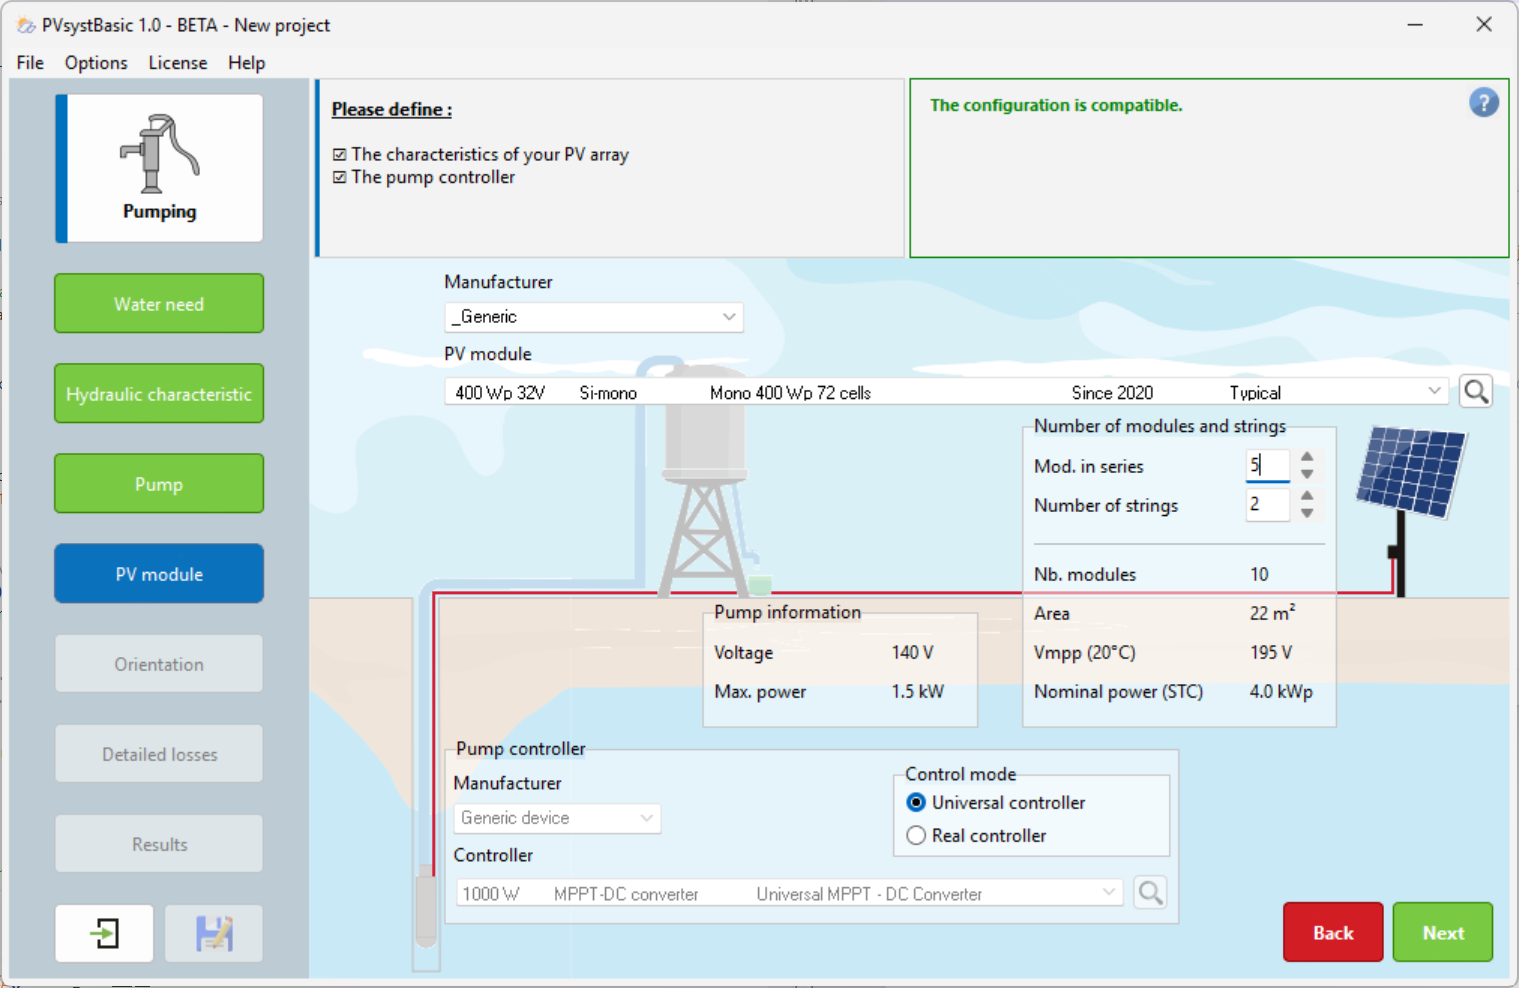
PV Module
This window allows you to select your photovoltaic panel model as well as the number of panels in series and parallel that you desire.
You will also need to select the pump controller best suited to your system.
Possible system configurations and coupling strategies:
- Universal controller: This is a fictional controller provided by PVsystBasic that adapts to all simulation conditions
- Actual controller to be selected from our database
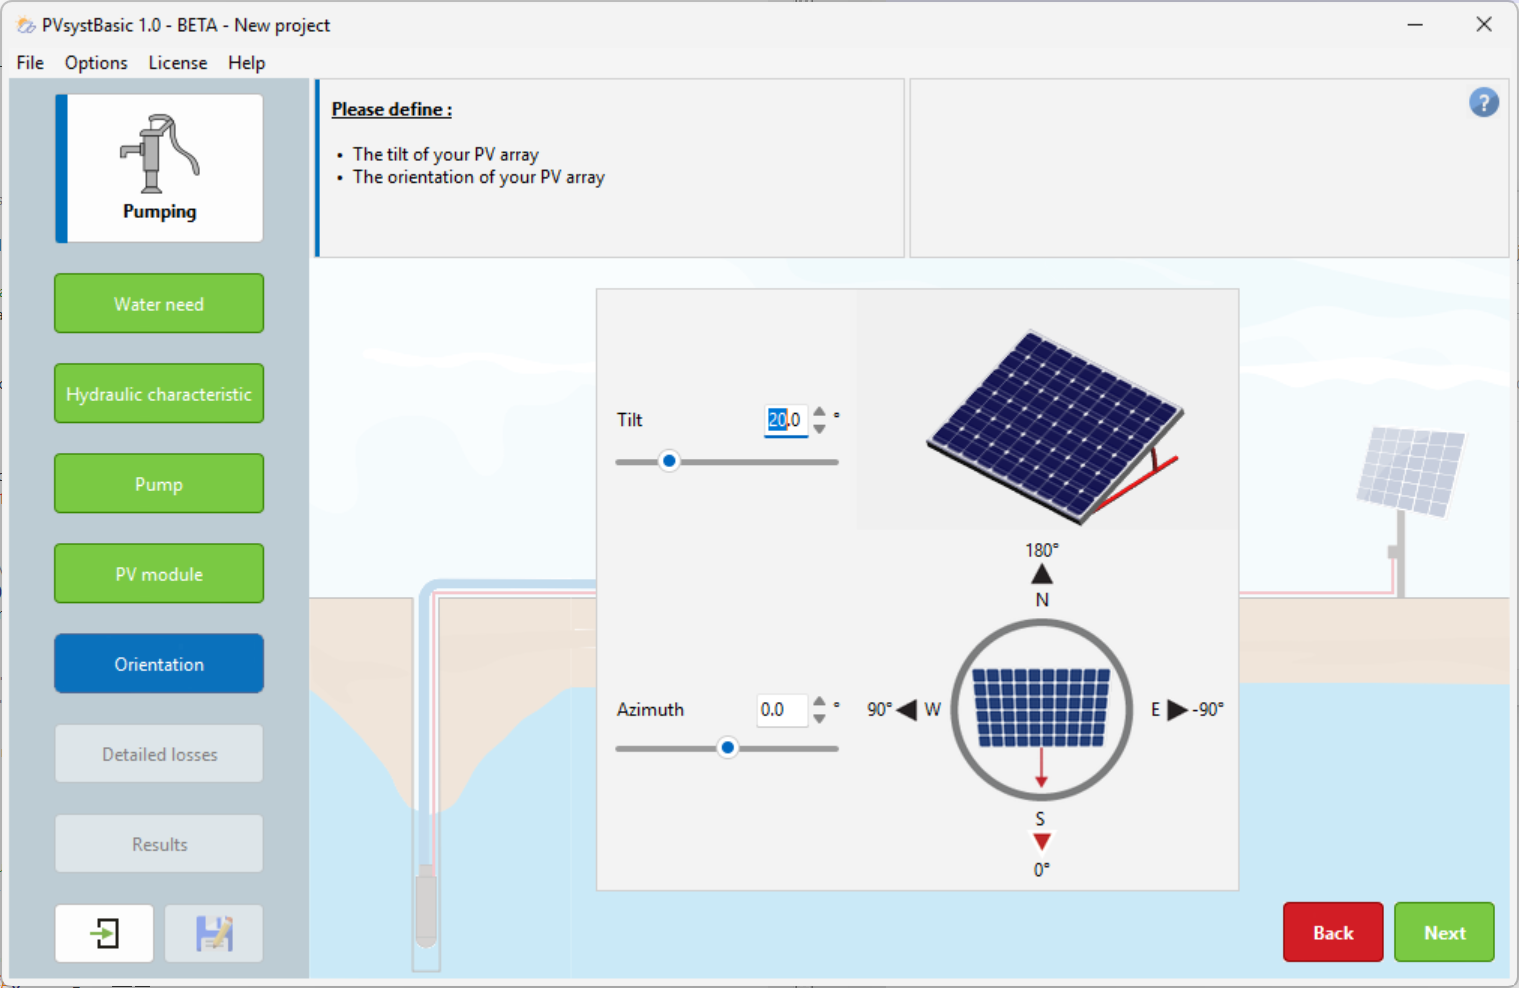
Orientation
This window allows you to determine the most suitable orientation and tilt for a photovoltaic system. The transposition factor is defined as the ratio between the incident irradiance on the inclined plane and the horizontal irradiance. In other words, it measures what you gain or lose by tilting the collector plane.
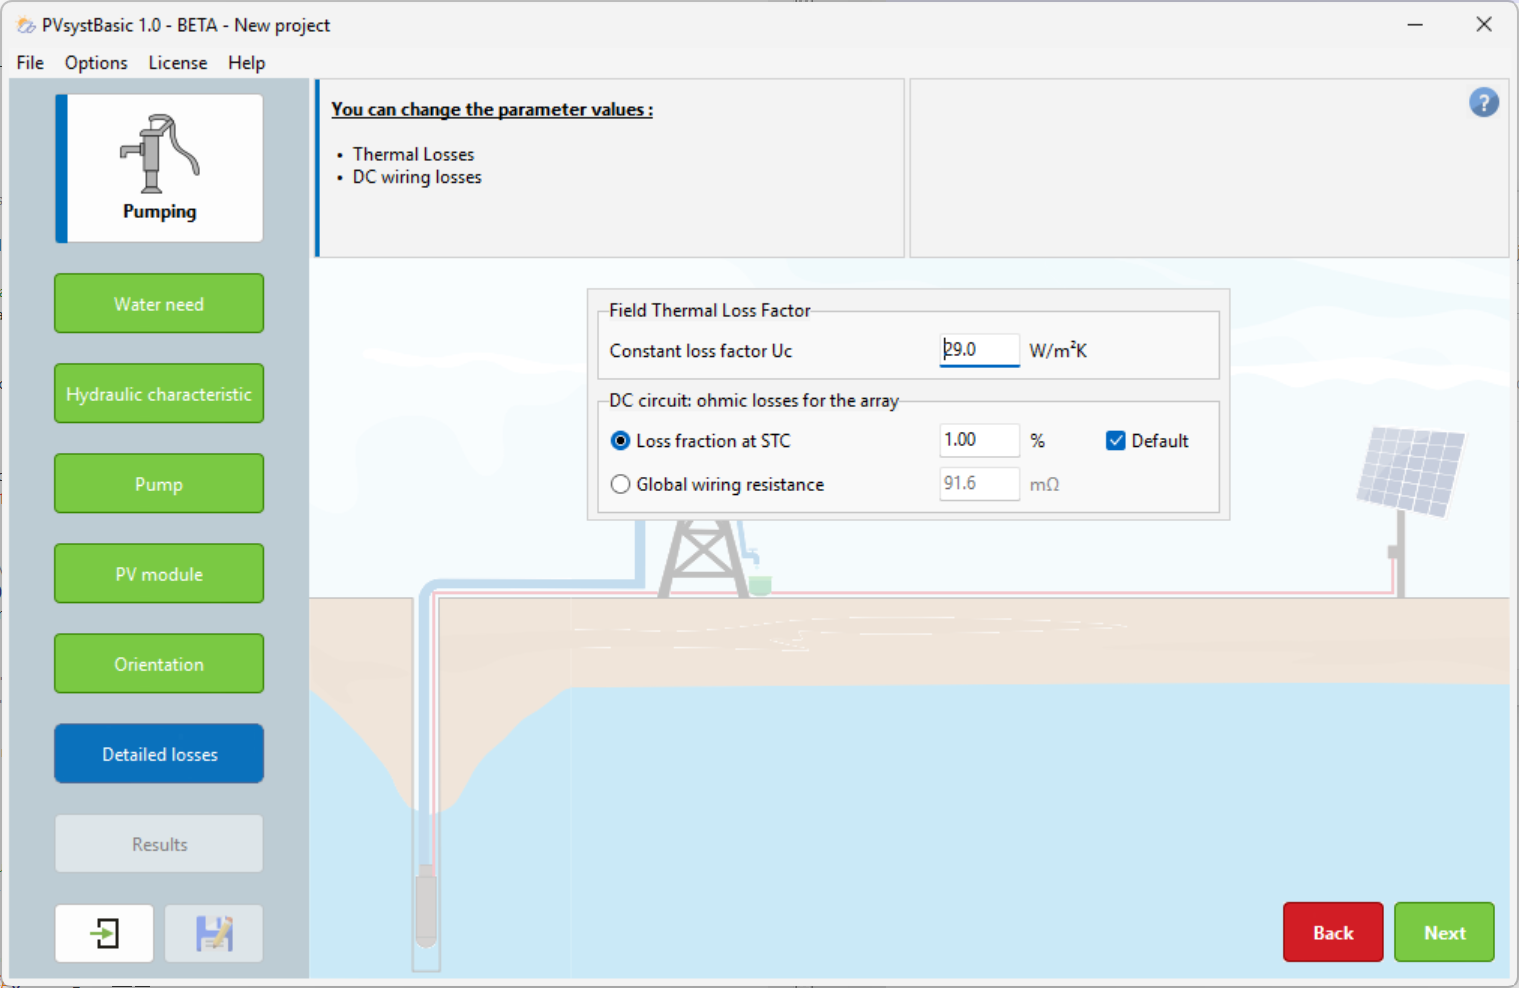
Detailed Losses
From this window, you can modify the default settings suggested by PVsystbasic if you wish:
- Constant loss factor Uc: Corresponds to the thermal loss factor of the PV array
- DC circuit: Corresponds to the ohmic losses for the PV array
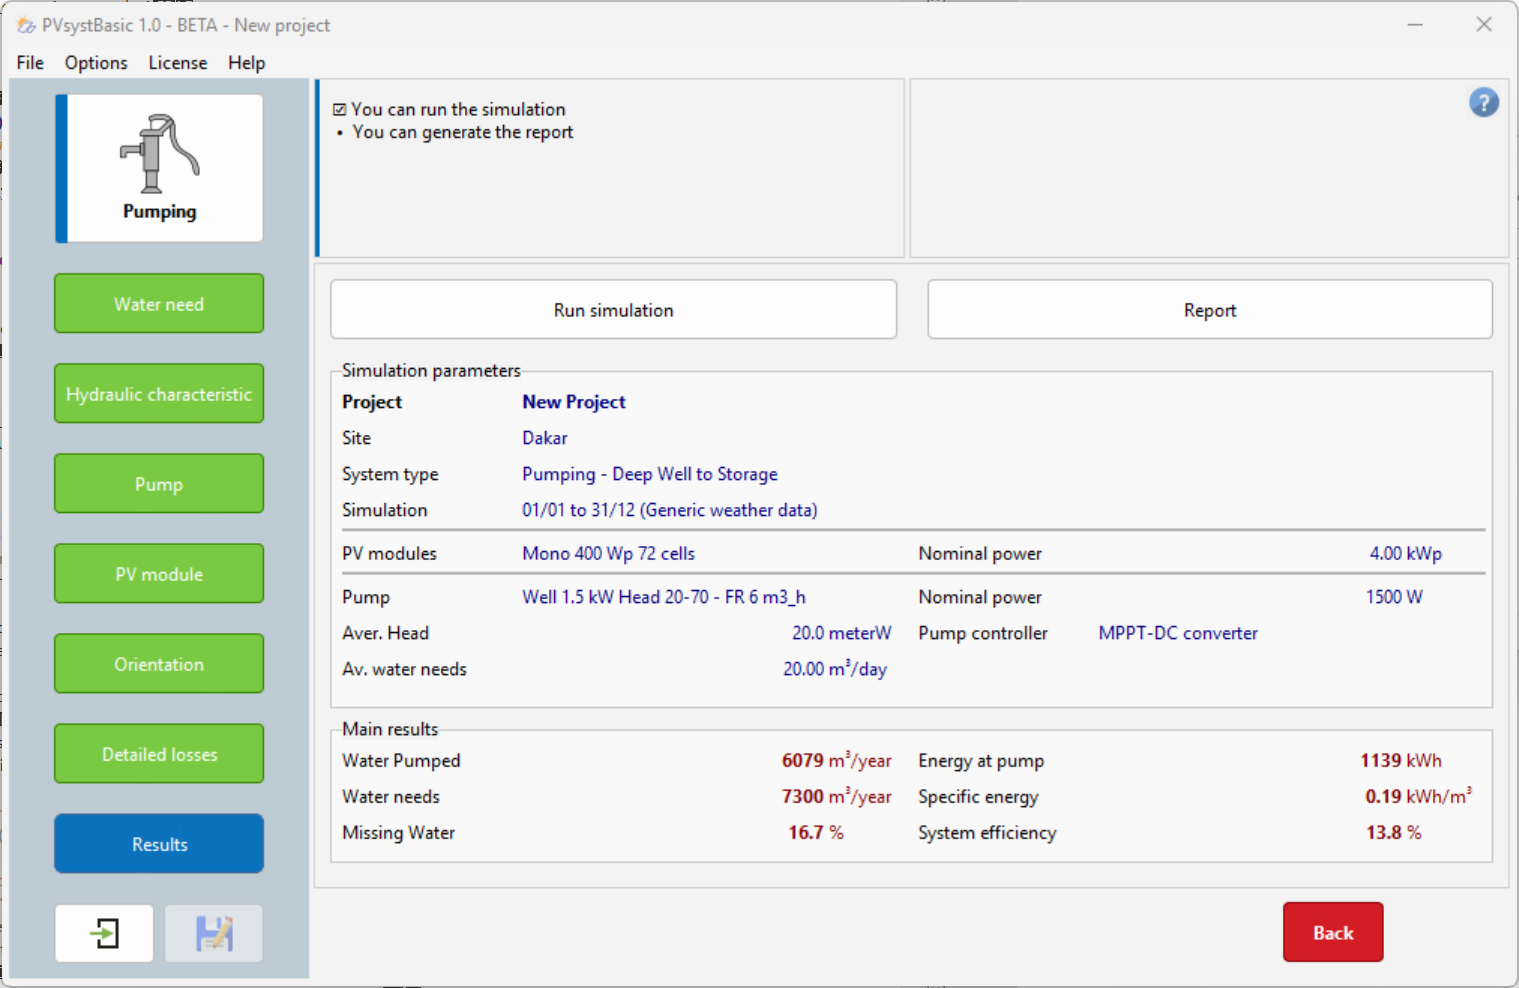
Results
On the project dashboard, all buttons are now green (or possibly orange).
The "Run Simulation" button is enabled, and you can click on it.
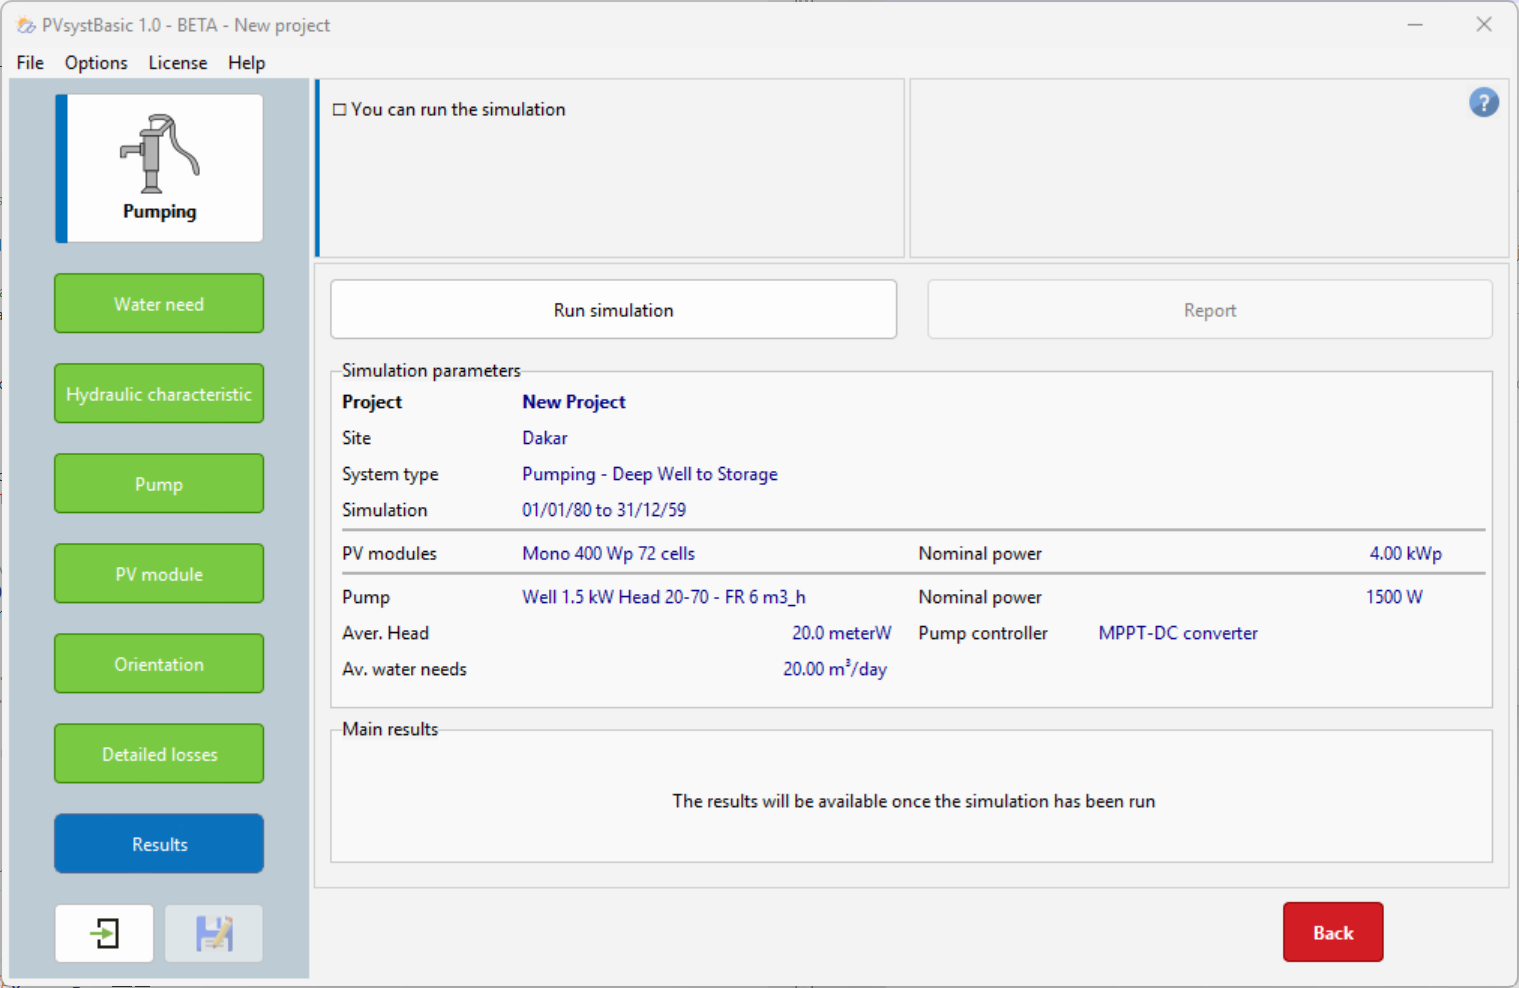
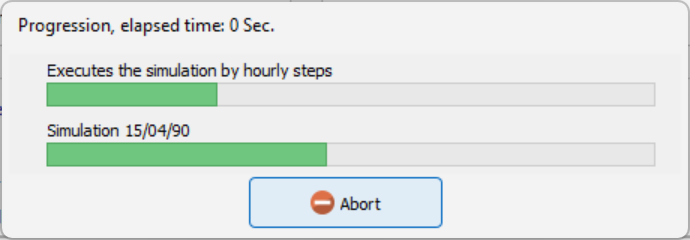
A progress bar appears to indicate how much of the simulation remains to be completed.
At the bottom, a box displays six values that summarize the main results of the simulation. This information provides a simplified overview and allows you to quickly detect obvious errors or get a first impression of a change or a comparison between different project variants.
For a complete description of your system, including all parameters used and detailed results, you can consult the simulation report.